

In the past decade, the stock market has evolved dramatically. With the rise of fintech firms and digital penetration, retail investments surged at a breathtaking pace. The playing ground for the domestic businesses also expanded with friendly government policies and ease of raising capital. While the entire market grew significantly, there are certain businesses that offered some unmatched profit growth.
In this article, we will try to explore three such companies that have delivered a profit growth of over 90% CAGR over the past 7 years. Let that sink in. Over 90% annualised growth in profit, over 7 years. Amazing, right?
Before we dig, in please note here we are considering companies whose profits grew organically and purely from growth in the operations and business, without any base effect or extraordinary/other income.
With that said, here goes…
#1 Data Patterns (India) Limited (DATAPATTNS)
Data Patterns (India) Ltd. is engaged in developing indigenous electronic products for the defence sector. From radars to airborne software-defined radios, jammer pods, radar warning receivers, and other electronic warfare products, the company manufactures it all.
In the past 7 years, Data Pattern offered a staggering profit growth of 108.6% Compound Annual Growth Rate (CAGR). The profit generated by the firm during FY18 was around mere ₹1 crore, which sharply grew to ₹295 crore in FY25.
This massive profit growth has been a result of the company’s continuous effort to deliver innovation across products. Over this same period, sales grew from ₹57 crore in FY18 to ₹708 crore in FY25, growing at 43.4% CAGR.
How did all this growth reflect in the share price?
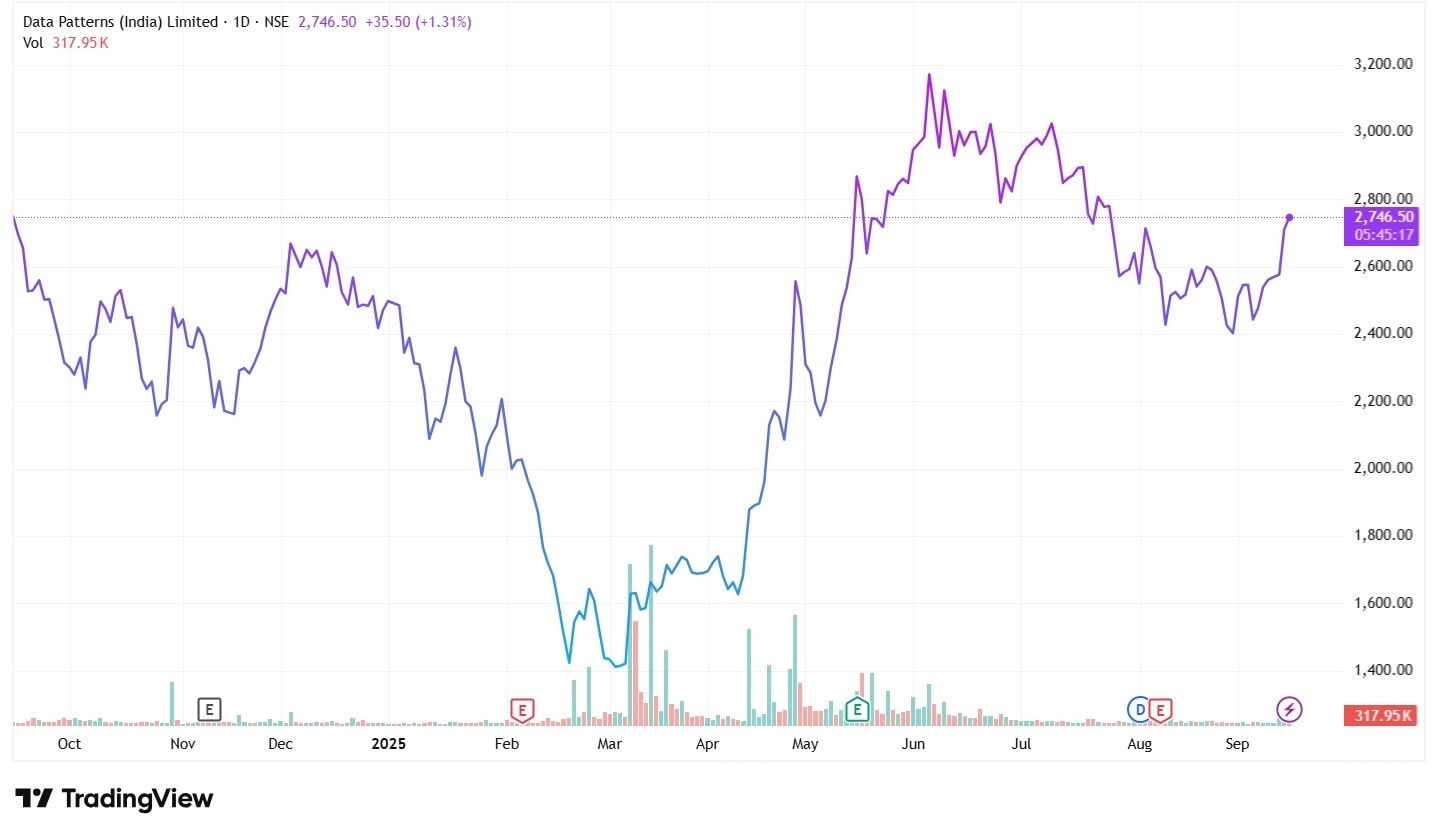
Data Pattern was listed on 24 December 2021 when its adjusted share price was ₹755. In less than 5 years, it’s now trading at ₹ 2,721. This would translate to a stupendous return of 260.4% over this time period.
Indigenous Product Portfolio
Data Pattern has a portfolio of electronics products that are developed after years of research, and this is perhaps one of the primary reasons for the massive growth of the company. It already has a portfolio of 9 precision approach radars, which they successfully delivered to the Ministry of Defence (MoD) for different uses across the Army and Navy.
The company is one of the few that designs the building blocks of the entire Radar System in India, as well as for Signal processing, transmit/receive module, and more. For electronic warfare, it has developed COMINT and ELINT systems and an SDR platform for communication systems in fighter aircraft, land-based radio relays, and other defence warfare equipment.
Investing in Growth
The company has been consistent with its capital expenditures (capex), and this could be another major reason for the growth it has been offering. In the last five years, it has already invested around ₹160 crore, and has plans for another ₹150 crore in the coming two years.
Growth Prospects
The Management of the firm expects the revenue to grow at around 20% to 25% for the upcoming 2-3 years and expects the Earnings before interests, taxes, depreciation, and amortization (EBITDA) margins to be around 30% to 40% during this fiscal year, FY26.
The current order book of the company stood at ₹814 crore as on 30 June 2025, and the company expects this to grow by around ₹3,000 crore in the next 2-3 years.
From the looks of it, the company is already geared up for growth in the years to come.
Valuation
The Data Pattern Share is trading at Price price-earnings (PE) ratio of 70.7x, slightly cheaper than the industry median of 73.2x. However, its price earnings to growth (PEG) ratio is at 2.2, which is higher than the industry median of 1.5.
1-Year Share Price Chart of Data Pattern (India) Ltd.
#2 Electrotherm (India) Limited (ELECTHERM)
Electrotherm (India) Ltd. is a multi-dimensional company with a market share of around 35,00,000 KW of the metal melting industry worldwide and a renowned name in the iron and steel industry. It manufactures BIS-approved epoxy-coated TMT bars, iron pipes, steel plant equipment, induction heating, and hardening equipment, and more.
During the past 7 years, the company’s profit grew at 95.4% CAGR, from ₹3 crore in FY18 to ₹442 crore in FY25. However, the growth has been disproportionate over the years. During FY22 and FY23, the company incurred losses of ₹40 crore and ₹12 crore, respectively. In FY24, the company turned around and delivered a massive profit of ₹317 crore (excluding an exceptional profit of Rs 121 cr), and further increased it in FY25.
The sales over this period grew from ₹2,927 crore in FY18 to ₹4,115 crore in FY25, at 5% CAGR only. The EPS went up from ₹2.3 per share in FY18 to a whopping ₹347 per share in FY25.
How did all this growth reflect in the share price?
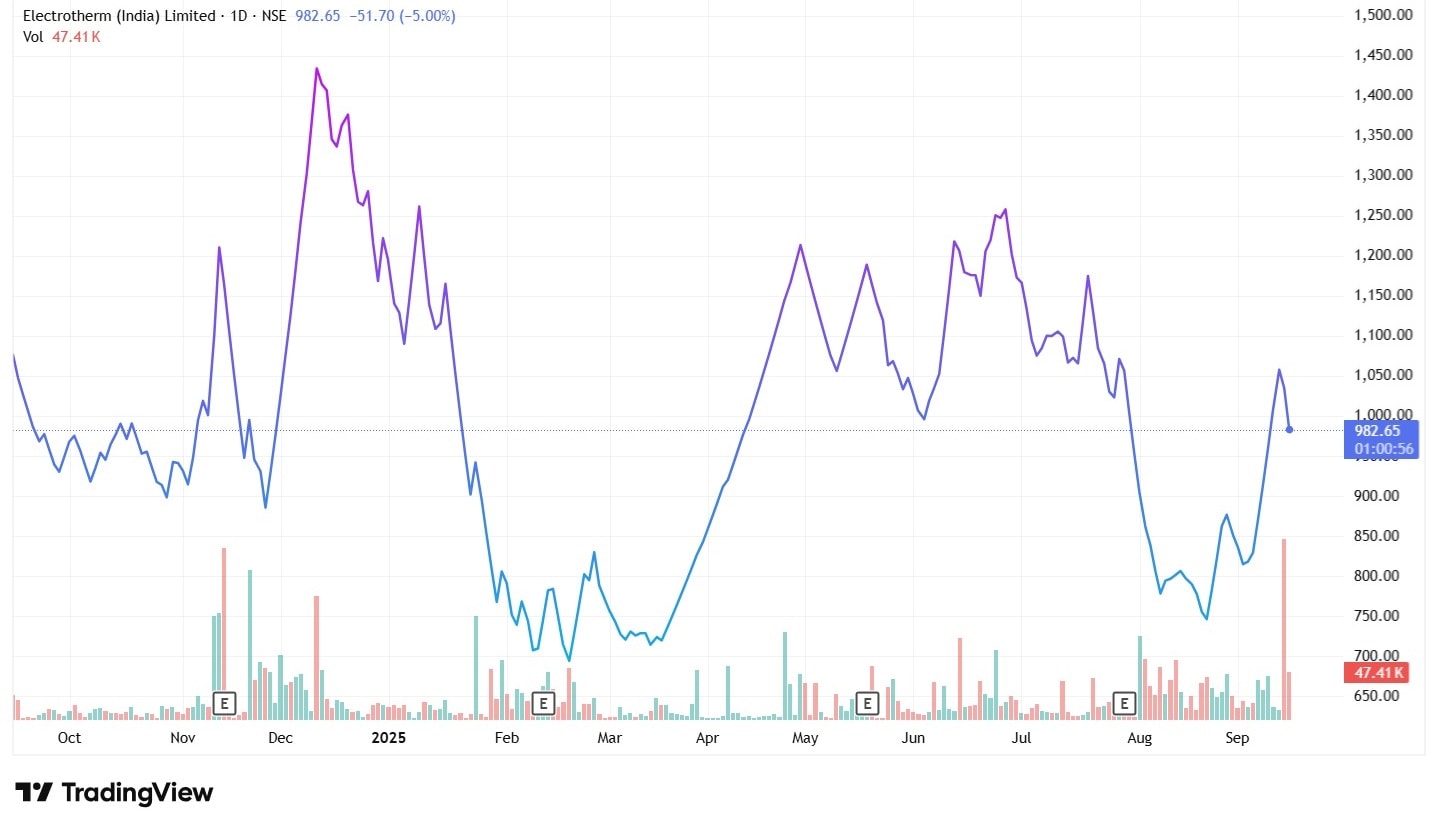
On 2nd April 2018, the adjusted share price of Electrotherm was ₹136. After 8 years, it’s now trading at ₹983. This would translate to a massive return of 622.3% over this time period.
Global Presence
The company’s unmatched growth can be attributed to its global presence. It has over 6,000 loyal customers across the globe, especially from the metal mining industries. Some of the top clients include – Jindal Steel & Power, Welspun, Godrej Appliances, AIA Engineering Ltd. and Ashok Leyland.
It has supplied over 6,500 induction melting furnaces to date and completed over 40 turnkey projects, which have given it an edge in the industry.
Business Outlook
The management expects the TMT steel bar segment to expand significantly as the overall market size is expected to grow at around 4.3% CAGR for the upcoming 5 years. They also expect the demand for Indian ductile iron pipes to grow as the overall demand for the same is growing at a 12.5% CAGR.
Navigating Crisis
While the company has witnessed a massive growth in its profits, it has had to face many challenges as well. In 2025, the Enforcement Directorate (ED) seized 37 bank accounts of the company and other assets owing to a bank fraud case against the company.
Valuation
Amidst all the crises and growing at such a pace, the company’s valuation remained cheap. The stock is trading at a PE of 5.2x, way cheaper than the industry median of 24.5x. Even the PEG ratio tells the same story, as it is at 0.05, while that of the industry is 0.45.
1-Year Share Price Chart of Electrotherm (India) Ltd.
#3 Ujjivan Small Finance Bank Limited (UJJIVANSFB)
Ujjivan Small Finance Bank Ltd. is a small finance bank that focuses on catering to the segment of the community that is financially underserved to increase financial inclusion. Its primary business is retail banking.
In the past 7 years, the profit of this small financial bank grew at an astounding pace of 94.7% CAGR. From just ₹7 crore in FY18, it grew to ₹726 crore in FY25. However, there have been severe fluctuations in the profits during this period. For instance, during FY22, the bank incurred loss of ₹415 crore, but then jumped to a ₹1,100 crore of profit in FY23, which further surged to ₹1,281 crore in FY24, then dropped to ₹726 crore in FY25. All in all very volatile you could say.
Having said that, the revenue of the bank remained stable and grew from ₹1,468 crore in FY18 to ₹6,354 crore in FY25, at 23.3% CAGR.
How did all this growth reflect in the share price?
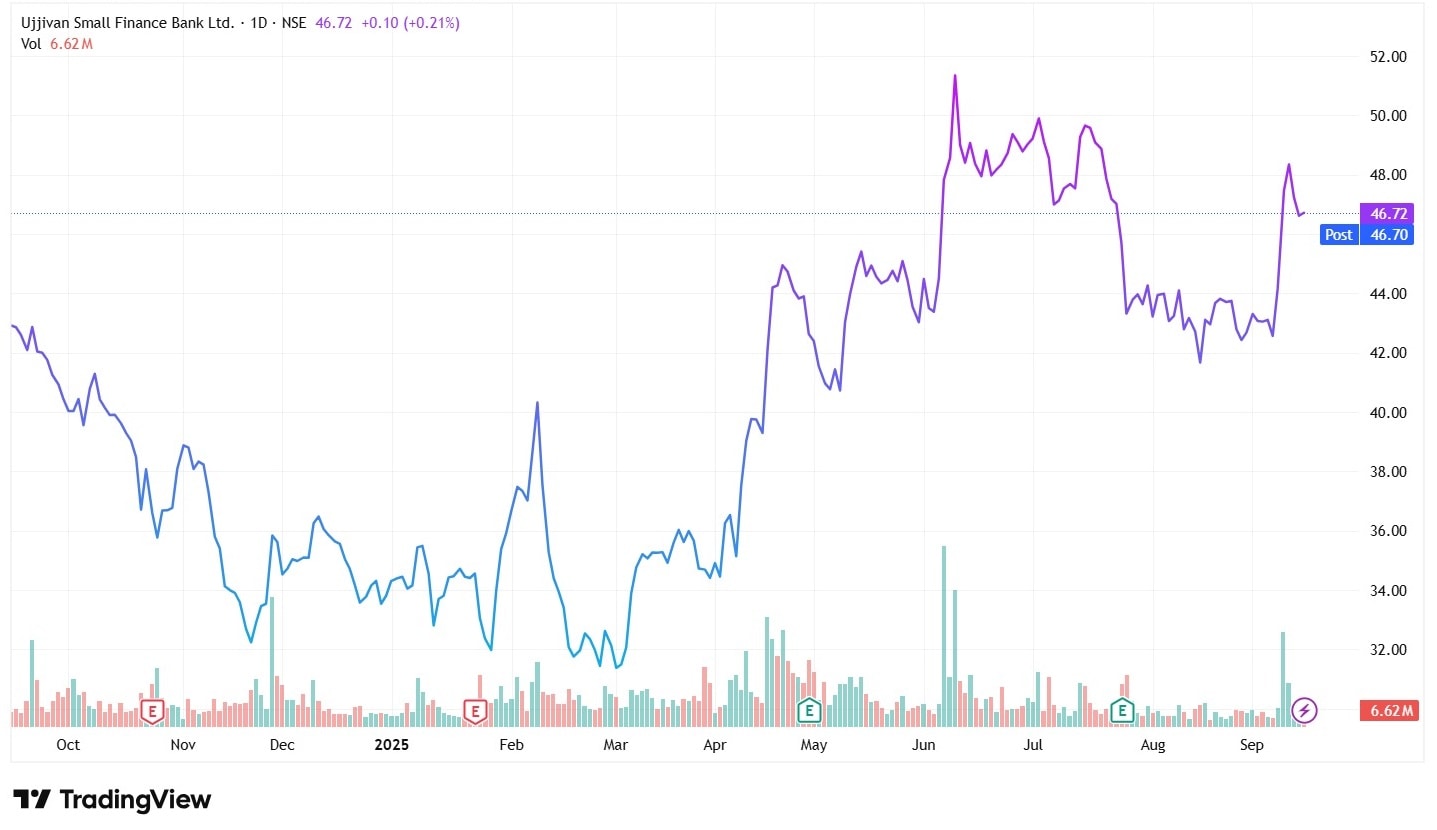
Ujjivan Small Finance Bank was listed on 13 December 2019 when its adjusted share price was ₹52. After a little under 6 years, it’s now trading at ₹46.70, which is a decline of 10.19% over this period.
Distinguished Business Model
The business model of the bank is unique. It focuses on the mass segment of the population, as well as the aspiring ones and affluent customers. The customer base went up from 59.2 lakhs in FY21 to 95.1 lakhs in FY25, almost 2x growth.
This took the gross loan book of the bank from ₹15,140 crore in FY21 to ₹32,122 crore in FY25 and the total deposits from ₹13,136 crore to ₹37,630 crore in FY25.
Key Ratios of Q1FY26
Coming to the key ratios of the June quarter, the bank witnessed a decline in the Net Interest Income (NII) from ₹941 crore in Q1FY25 to ₹856 crore in Q1FY26, and the net interest margin (NIM) slashed from 9.35% to 7.7% Year-on-Year (YoY).
Even though the return on assets (ROA) dropped from 2.9% to 0.8% YoY in Q1FY26, the return on equity (ROE) tanked from 20.9% to 6.7% YoY. This fall in these key ratios is owing to the fall in the net profit of the bank in Q1FY26 compared to Q1FY25.
The net non-performing assets (NNPA) have also increased by 32 basis points from 0.4% in Q1FY25 to 0.7% in Q1FY26.
Business Outlook
While the numbers declined in the previous quarter, the long-term outlook of the bank remains intact, as per its management. They are expecting their deposits and advances to grow up to ₹1 lakh crore by FY30, growing at 20% to 25% CAGR, out of which 60% to 65% is secured share.
They also expect NIM to stabilize around 6% to 7% in the coming 4-5 years and maintain an ROA of around 1.8% to 2%, and ROE of around 16% to 18%.
The bank has also applied for a Universal Bank License in February 2025, and they are expecting the same by this December. This license can open new avenues for the bank, which include co-lending, investments, securitization, and other benefits.
Valuation
The stock is trading at a PE of 17.16, almost at par with the industry median of 17.01, while the PEG ratio stands at 0.31, compared to 0.35, which is the industry median.
1-Year Share Price Chart of Ujjivan Small Finance Bank Ltd.
Wrapping up
Innovation, unique business models, quality products, and services are a few of the reasons that made these companies stand out in the long term. These companies faced multiple challenges along the way, but their resilience brought them back in the game every time. They have already delivered some extraordinary profits during the last seven years, and now they are eyeing more growth in terms of business avenues, innovation, and whatnot. So, it will be interesting to see whether their new ventures also turn profitable or not.
Disclaimer
We have relied on data from www.Screener.in throughout this article. Only in cases where the data was not available have we used an alternate, but widely used and accepted source of information.
The purpose of this article is only to share interesting charts, data points and thought-provoking opinions. It is NOT a recommendation. If you wish to consider an investment, you are strongly advised to consult your advisor. This article is strictly for educative purposes only.
Maumita Mitra is a seasoned writer specializing in demystifying the world of investment for a broad audience. She has a keen eye for detail and a knack for explaining complex financial concepts in the simplest manner possible.
Disclosure: The writer and her dependents do not hold the stocks discussed in this article.
The website managers, its employee(s), and contributors/writers/authors of articles have or may have an outstanding buy or sell position or holding in the securities, options on securities or other related investments of issuers and/or companies discussed therein. The content of the articles and the interpretation of data are solely the personal views of the contributors/ writers/authors. Investors must make their own investment decisions based on their specific objectives, resources and only after consulting such independent advisors as may be necessary.