")
From 2014 to 2022, the rise in Adani Group stocks was nothing short of amazing. What began as a steady growth story turned into a full-blown cycle of making money.
The group represented India’s capital expenditure story in terms of infrastructure, ports, power, transmission, and renewables. Investors who followed the trend saw their profits grow by a huge amount.
Then the storm hit.
The Hindenburg Aftermath: A Three-Year Consolidation
In January 2023, Hindenburg Research, a US-based short seller, put out a long report that alleged the Adani Group had been creative in its accounting policies and was manipulating its stocks.
The effect was quick and terrible. Market capitalisation of Adani group stocks fell sharply, debt concerns intensified, and investor sentiment soured.
Stocks that had been going up in a straight line started to go down in a straight line.
The episode reminded us that markets can go from happy to scared in a matter of weeks.
Most Adani Group stocks are still trading below their highs from 2023, except for a few like Adani Ports and Special Economic Zone Ltd and Adani Power Ltd.
It’s been three years and investors are still hoping for the best in the Adani group.
Is this the Year of the Adani Group stocks?
From a technical point of view, three stocks have structures that need to be looked at:
#1 Adani Enterprises Ltd. (ADANIENT)
During the panic of 2023, Adani Enterprises‘ price fell from a high of Rs 4,062 to Rs 986.
After that, it went through a long period of consolidation, mostly staying between Rs 2,000 and Rs 3,000. This sideways movement wasn’t random; it shows what classical chart readers call a re-accumulation structure as Richard Wyckoff’s theory.
Adani Enterprises Share Price Chart
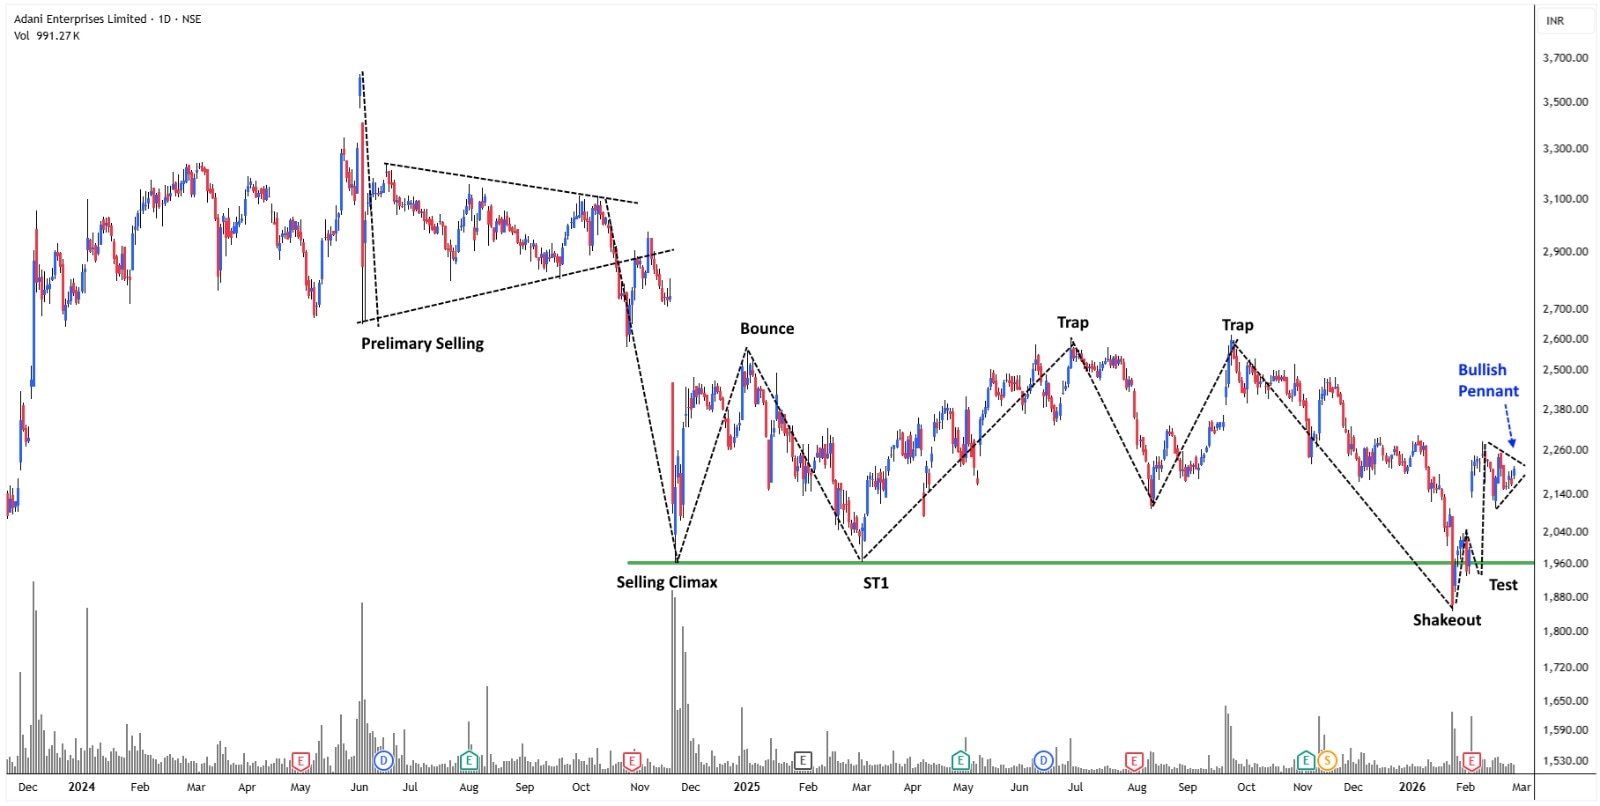
Wyckoff Accumulation Structure in Action:
- Preliminary Selling (PS): Demand outstripped supply when prices dropped from Rs 3,629 to Rs 2,650.
- Selling Climax (SC): In December 2024, the price fell to Rs 1,963 because of panic-driven selling that marked the end of supply.
- Secondary Tests and Traps: Multiple failures near Rs 2,600 formed the trap and shook out weak hands.
- Spring or Shakeout (January 2026): The decisive low of Rs 1,848 broke through previous support and turning around marks the sign of demand outstripping supply.
What the Shakeout Means
In Wyckoff terms, a “spring” is a planned final push below support levels. It catches sellers who wait too long and sets off stop-losses. But when the price quickly goes back to the range, it means that strong hands have taken in the supply.
This is where the real bottom usually happens, not in fear but in tiredness.
After the spring of January 2026, ADANIENT began to form a higher high–higher low structure, which is in line with Charles Dow’s Dow Theory. That change from distribution to demand is very important.
A Bullish Pennant has formed on top of the setup. This is a continuation pattern that shows the stock is taking a break before moving on to the next leg.
If the re-accumulation theory is correct, the stock probably test the Rs 3,200 level again over the next few quarters. From a structural point of view, the risk-reward seems to be getting better.
1. Adani Energy Solutions Ltd (ADANIENSOL)
Adani Energy Solutions and Adani Enterprises have the same technical structure. The stock seems to be building a base that fits with Wyckoff’s accumulation principles after a long correction.
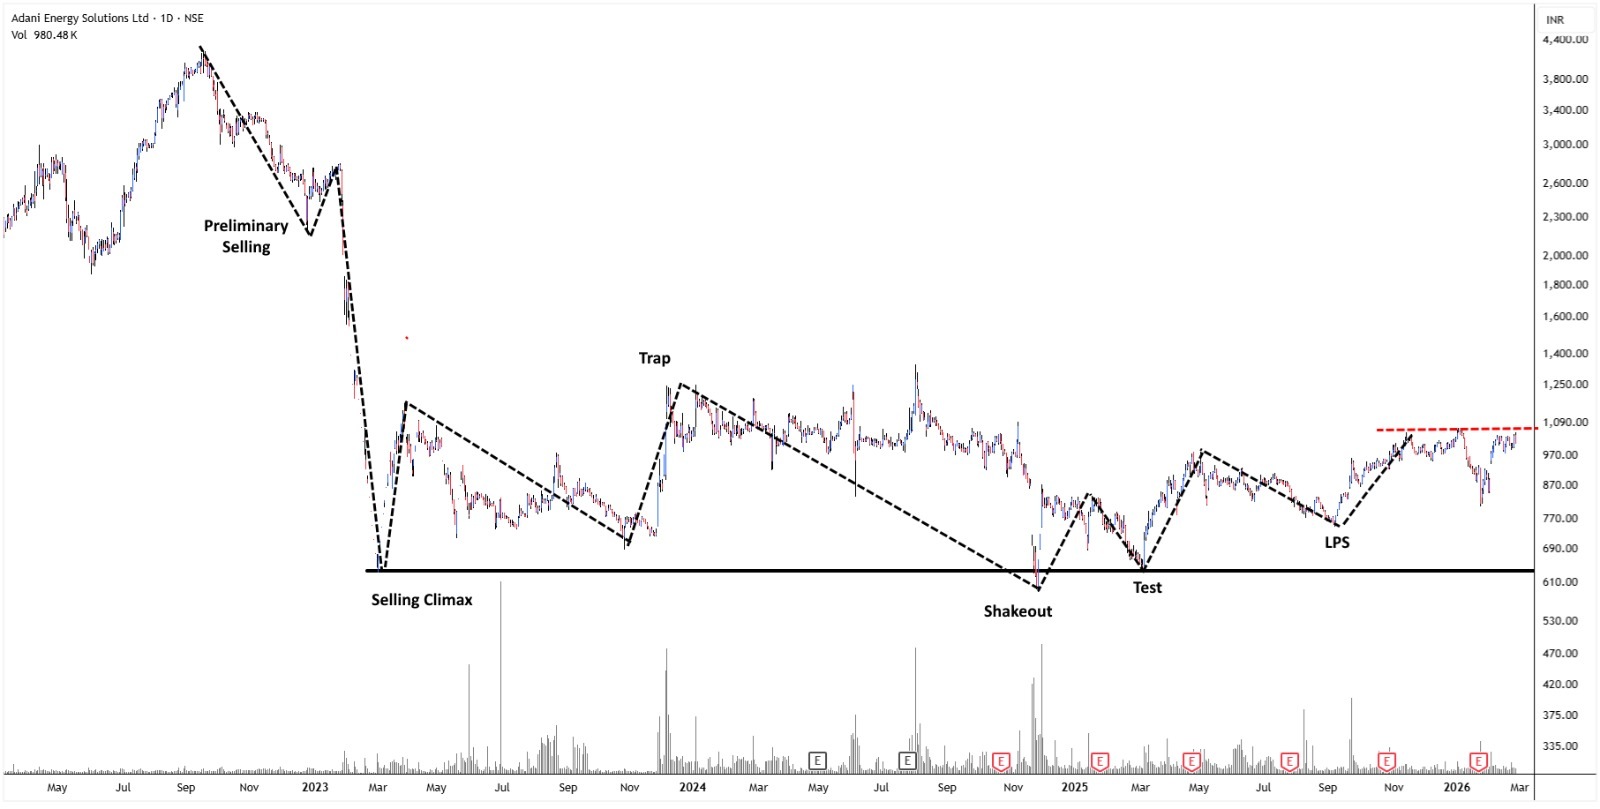
The Last Point of Support (LPS) is a very important part of this process.
The LPS happens after the spring in Wyckoff’s method. It is the first significant pullback that stays above the shakeout low, which shows that sellers have lost control.
The stock is now trading close to a minor resistance zone at Rs 1,100. If the price stays above this level, it could start a new bullish trend that could take it all the way to Rs 1,600.
In markets that are going up, themes about energy transmission and infrastructure often come back before more general cyclical participation. If institutional demand comes back to the Adani basket, ADANIENSOL could be one of the first to move.
2. Adani Power Ltd. (ADANIPOWER)
Adani Power has had an interesting structural rhythm since 2019.
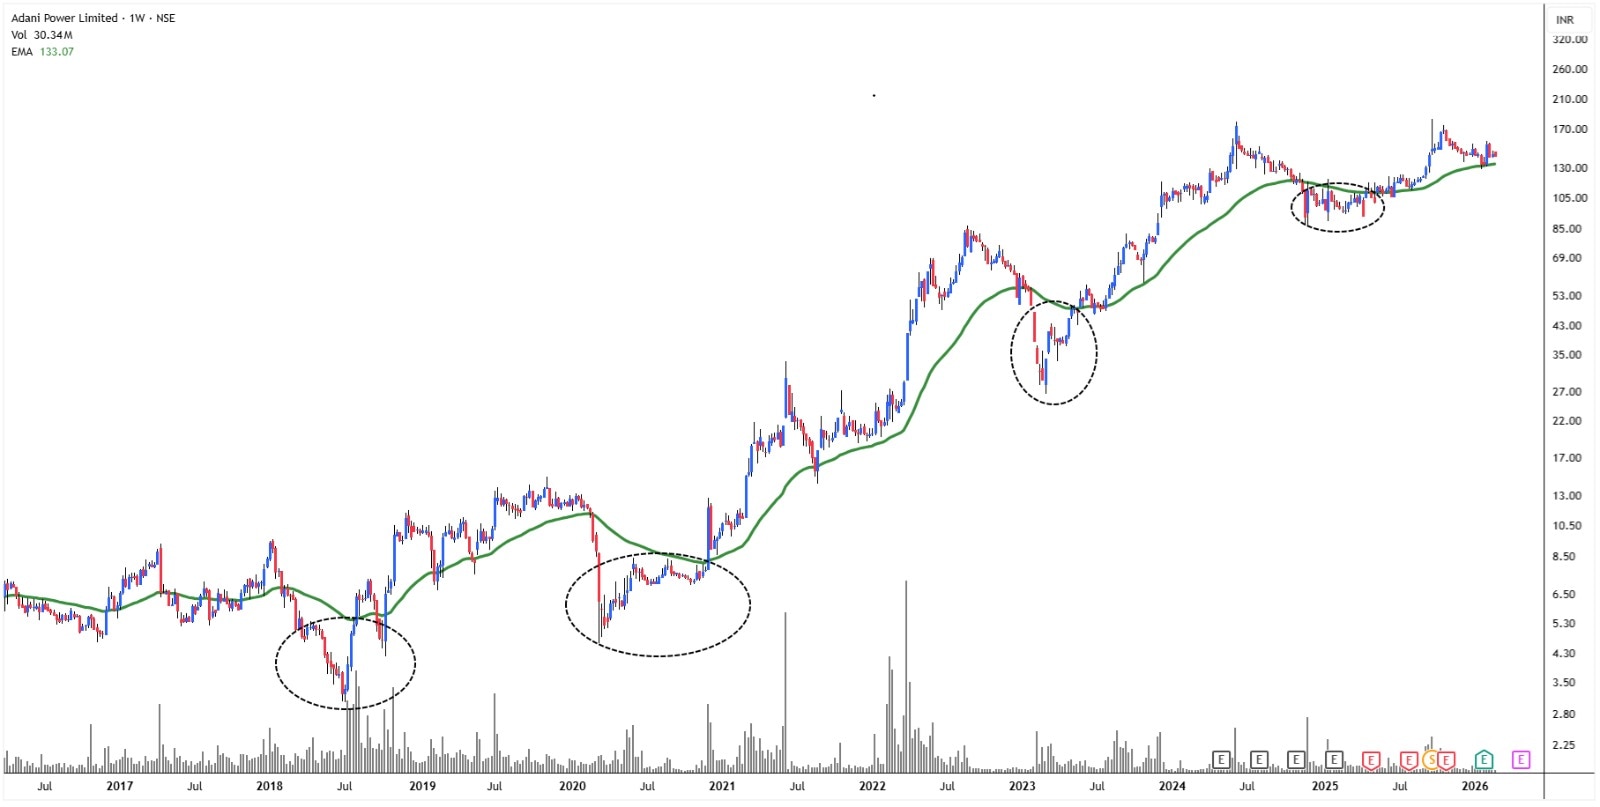
On the weekly chart, each major bottom has formed when the stock clearly reclaimed the 50-week Exponential Moving Average (50EMA) after trading below it. If the price closes above the long-term average, it means that buyers are feeling better about the market in the short term.
This is the fourth time that price has formed a base below the 50EMA, followed by a strong reclaim.
Markets are fractal by nature. When patterns repeat over cycles, they show how investors remember things.
If history repeats itself, ADANIPOWER could reach new highs, maybe even over Rs.200 in the future.
Adani Stocks Setting the Stage
Technical analysis does not predict; it prepares. The Adani Group is a symbol of India’s desire to build more infrastructure. But charts show the fight between fear and conviction more than stories do.
The 2023 episode put investors minds to the test. The long period of consolidation tested investors patience. Now, 2026 could test your faith.
Are these stocks in a bull market for sure? Not yet.
Breakouts need to last. Volumes need to grow. The structure must stay in place. But the first signs of re-accumulation, such as higher highs and lower lows, springs, LPS formations, and moving average reclaims.
If 2023 was the year of the end, 2024–25 were the years of fixing things. Maybe 2026 could quietly be the year of revival. And markets reward investors who can read the quiet times correctly.
Disclaimer:
Note: The purpose of this article is only to share interesting charts, data points and thought-provoking opinions. It is NOT a recommendation. If you wish to consider an investment, you are strongly advised to consult your advisor. This article is strictly for educative purposes only.
Brijesh Bhatia is an Independent Research Analyst and is engaged in offering research and recommendation services with SEBI RA Number – INH000022075. He has two decades of experience in India’s financial markets as a trader and technical analyst.
Disclosure: The writer and his dependents do not hold the stocks discussed here.
The website managers, its employee(s), and contributors/writers/authors of articles have or may have an outstanding buy or sell position or holding in the securities, options on securities or other related investments of issuers and/or companies discussed therein. The content of the articles and the interpretation of data are solely the personal views of the contributors/ writers/authors. Investors must make their own investment decisions based on their specific objectives and resources, and only after consulting such independent advisors if necessary.