
")
India’s electric two-wheeler market has moved beyond being a niche experiment and is now firmly in the mainstream. With rising adoption, policy support, and improving cost economics, the market is starting to reveal clear leaders. Interestingly, it is not Bajaj Auto or Hero MotoCorp, who are long considered dominant in the two-wheeler space, but newer challengers who have taken the early lead.
Among these, TVS Motor and Ather Energy are in the top three positions in the market share figures of the month of August. Both have built scale, differentiated product portfolios, and strong technology capabilities that position them well for the next phase of growth.
Let’s take a closer look at how these companies are positioned to benefit from the EV transition.
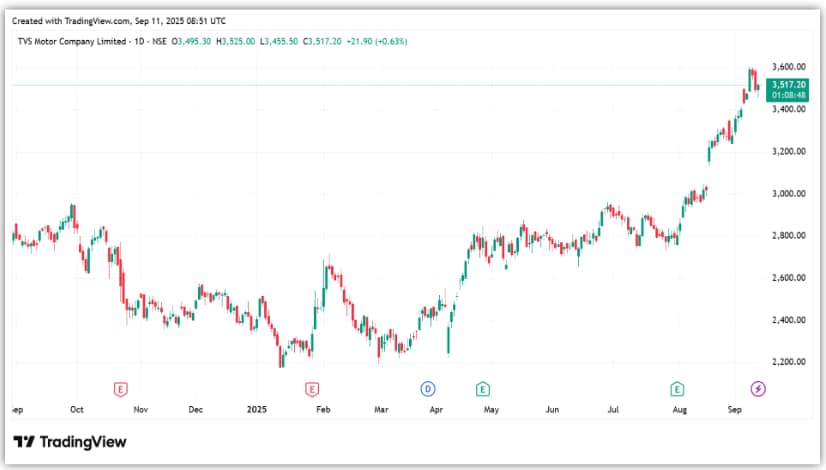
TVS Motor: 24% EV market share with iQube at the centre
TVS Motor, a part of TVS Group, is among the largest two-wheeler manufacturers in India. The company manufactures a wide range of two-wheelers and three-wheelers, and is the only domestic manufacturer of mopeds. TVS has a production capacity of 6.1 million two-wheelers and 0.2 million three-wheelers.
Building dominance with iQube at the core
TVS has been investing heavily in research and development, with a focus on technological innovation and product development. Since launching its first electric scooter (e2W), TVS iQube, in January 2020, it has expanded its presence across India. TVS is now also the leading player in the e2W segment, with a market share of 24%.
With the iQube, TVS struck the right balance between pricing, reliability, and range, something its peers initially struggled with. TVS iQube model is now the market leader, having sold over 600,000 units. Additionally, to maintain momentum, TVS has expanded the TVS iQube portfolio to six variants, making it one of the widest and most compelling offerings in the segment.
Strong financial performance with margin gains
Today, EVs contributed 17.31% to TVS’s total scooter volumes in FY25, up from 14.10% in FY24. In Q1FY26, TVS revenue rose 20% year-on-year to ₹100.8 billion, driven by a 17.4% increase in volumes. e2W sales volume grew 35% in Q1FY26, and accounts for 14% of total EV sales.
The company’s EV business has a positive gross margin. TVS consolidated operating EBITDA (earnings before interest, tax, depreciation, and amortization) rose 32% to ₹12.6 billion. Profit after tax (PAT) rose 32.6% to ₹6.4 billion.
Expanding into global and e3W EV markets
Looking ahead, TVS aims to launch its premium EV and internal combustion engine (ICE) range in France and Italy. Models including Jupiter 125, Ntorq, iQube S, TVS X, Ronin 250, Apache RR 310, and Apache RTR 310 will be available in Europe. It has also launched the electric BMW CE 02, targeting global markets in the e2W segment.
TVS also launched its first electric three-wheeler, the TVS King EV Max, with active plans to expand into electric cargo three-wheelers. The company plans to scale its presence further, aiming for a higher share in the EV e3W category.
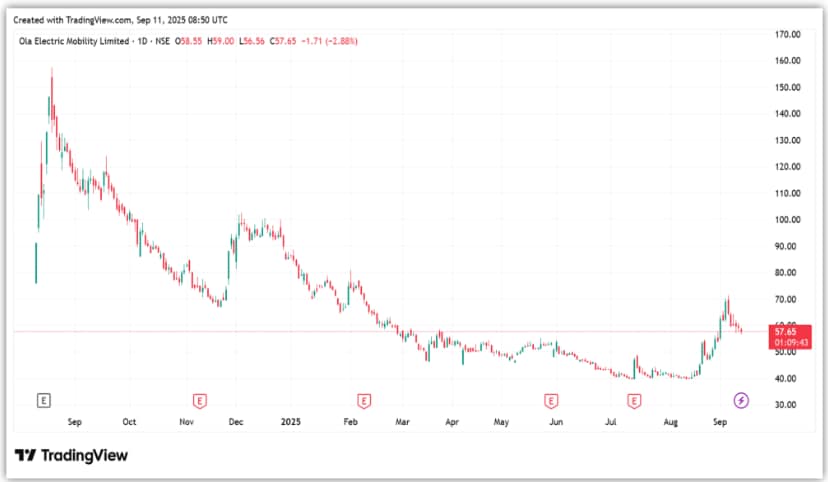
Ola Electric: 17.4% EV market share, with governance still under scrutiny
Ola Electric is an integrated manufacturer of e2W and core components. The company also manufactures battery packs, motors, and vehicle frames.
Scale, ambition, and early disruption
Ola, with a first mover advantage, wrote the rules with aggressive pricing and bold marketing. It leaned on scale and ambition to outpace incumbents, forcing even legacy players to join the race. However, it has lost the plot as it expanded aggressively, without focusing on product quality, customer services, and governance, etc.
Financial strain and governance challenges
From a financial standpoint, Ola’s revenue declined 49.6% year-over-year to ₹8.3 billion in Q1 FY26, primarily due to a 45.5% decrease in volumes to 68,192 units. The company lost market share significantly, by 3040 bps to 19.6%, from nearly 50% in the same quarter last year.
Corporate governance issues, along with poor product and service quality, have weighed on Ola. Even though it remains the second-largest EV player for now, helped by Bajaj Auto slipping to fifth place from second due to production disruptions, its problems are far from over.
But the company has shown some progress. The cost per vehicle has been reduced by ₹10,000 due to the adoption of Gen 3 platforms, lower costs, and in-house manufacturing of motors, electronics, etc. This enabled its gross margin to expand by 720 bps to 25.6%. Its project Lakshya also helped it lower its cost from ₹178 crore per month to ₹105 crore per month.
Ola continues to post losses, with an EBITDA margin of -28.6%, an increase of 1,610 basis points. Net loss widened by 23.3% to ₹4.3 billion. The company aims to achieve 5% margin and a 35-40% gross margin in FY26.
Betting on cost efficiency and new product launches
Looking ahead, the company is focusing on more balanced and profitable growth. It is targeting sales of 325,000 to 375,000 units in FY26. Bikes are expected to account for 15-20% of total sales, with the company expecting a pickup around the festive period.
Ola also has a vast product portfolio in mature stages of development. These products are expected to be launched once sales of existing products pick up. The company is also planning to deliver scooters faster than the traditional 3-5 days, which is expected to increase demand.
The company has also slowed down its capital expenditure, except for the 6.4 gigawatt cell manufacturing project, in which it is investing ₹10 billion. Of 6.4 GWh, 1.4 GWh will go live in FY26, and the rest is expected to go live in FY27. With an in-house manufacturing facility, Ola aims to reduce costs and enhance gross margins from FY27.
From a valuation standpoint, Ola Electric trades at a price-to-sales multiple of 7x, which is lower than Ather Energy (9x). Note that, after over 60% correction from the August 2024 high, the Ola share price factors most of the negatives.
Ather Energy: the underdog EV Player with 17.3% market share
Ather Energy is a pure-play e2W manufacturer, with an integrated ecosystem. The company controls over 100% of its software stack and 80% of key hardware. Although it has a market share of 17.3% (as of August 2025) in India, the company leads in South India and Gujarat.
The company sources 99% of its components domestically, in line with the government’s “Make in India” mandate. Its manufacturing plant at Hosur (Tamil Nadu) has an annual installed capacity of 420,000 e2W and 379,800 battery packs.
Ather has a wide footprint, although concentrated, with 446 stores across its network. Ather follows an asset-light model, in which partners invest and bear the expenses of stores and service centers. Ather, on the other hand, delivers brand building and marketing support.
R&D depth and integrated ecosystem
Ather’s biggest differentiation is its investment in research and development (R&D). With 45% of Ather’s employees in R&D, it is one of the largest e2W companies worldwide, boasting such a large R&D team. This focus enables cost optimisation, such as a 30% reduction in bill of material costs for the Ather 450X LR.
It has a diversified e2W portfolio, including the Ather 450 and Ather Rizt, with the former accounting for 57% of the total sales volume as of FY25. Its proprietary software, AtherStack, digitally powers its products from ride statistics to over-the-air updates.
The AtherStack Pro Pack bundle, which unlocks advanced features, is purchased by 88% of its e2W customers and accounts for 6% of the revenue. In addition, Ather also boasts of India’s leading e2W fast-charging network through Ather Grid.
Its focus on the key market, integrated manufacturing, and own charging network, along with Ola losing market share, allowed it to expand its presence. In FY25, it has 3,611 chargers in over 360 cities across India, Nepal, and Sri Lanka. Apart from this, the company also offers accessories, such as smart helmets, which provide higher margins.
Steady financial progress with improving margins
From a financial standpoint, Ather’s revenue increased 78% year-over-year to ₹6.4 billion, driven by a 97% rise in volume to 46,078 units. An increase in market share drove volume growth. The company gained 670 basis points (bps) of market share, reaching 14.3% in the first quarter. Its share in Middle India (Gujarat, Maharashtra, MP, Chhattisgarh, Odisha) rose 2.5x to 10.7%.
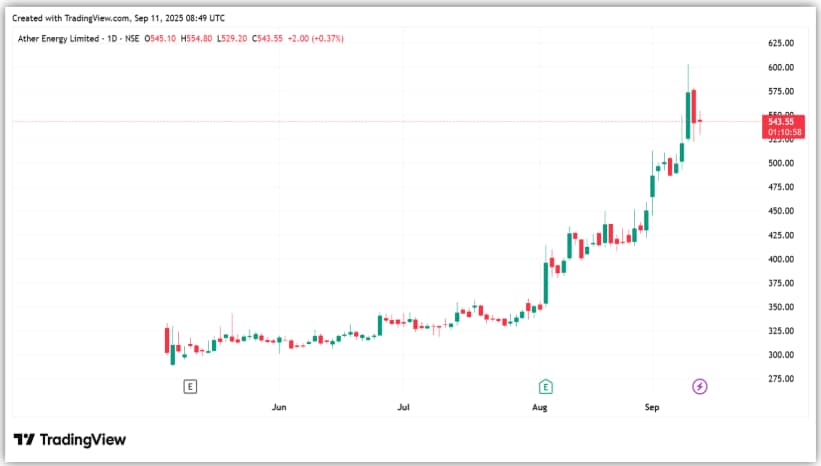
Although sales increased, revenue per vehicle sales fell 10% to Rs 1,21,729. But with volume growth, operating leverage kicked in. EBITDA margin increased 1700 bps to -16% from -33% in the same quarter last year. Nevertheless, net loss narrowed 3% to Rs 1.8 billion.
Scaling presence and broadening product portfolio
Looking ahead, Ather is gradually moving towards profitability, although not immediately. Having optimized costs in its existing models, Ather has now rolled out the EL platform, which aims to push cost efficiency further while offering scalability across future products. Ather also expects the service revenue to expand in line with volume growth.
The higher-margin accessories business is also likely to see a meaningful increase. Ather is also expanding in North India, with the addition of new stores. It also plans to launch a 150-180 cc motorcycle. Last but not least, given the demand, Ather is expanding its annual capacity by 0.5 million to 1.4 million e2W.
From a valuation standpoint, Ather trades at a price-to-sales multiple of 9x, which is higher than Ola Electric (7x).
Bottomline
The e2W race in India is no longer just about proving viability; it is now about scale, cost efficiency, and market positioning. TVS Motor has leveraged its iQube portfolio to capture a meaningful market share, while Ather Energy has relied on technology and a strong R&D focus to carve out a differentiated space. Both are still investing heavily, which means profitability will take time, but the trajectory is clear.
At the same time, Ola Electric, although at second place, is still grappling with its corporate governance issues. However, it is building a massive cell manufacturing facility, which, if successfully phased in, could prove to be a significant turnaround. However, for Ola, improving corporate governance and product and service quality should be of utmost importance, above everything else.
Disclaimer:
Note: Throughout this article, we have relied on data from http://www.Screener.in and the company’s investor presentation. Only in cases where the data was not available have we used an alternate but widely used and accepted source of information.
The purpose of this article is only to share interesting charts, data points, and thought-provoking opinions. It is NOT a recommendation. If you wish to consider an investment, you are strongly advised to consult your advisor. This article is strictly for educational purposes only.
About the Author: Madhvendra has been deeply immersed in the equity markets for over seven years, combining his passion for investing with his expertise in financial writing. With a knack for simplifying complex concepts, he enjoys sharing his honest perspectives on startups, listed Indian companies, and macroeconomic trends.
A dedicated reader and storyteller, Madhvendra thrives on uncovering insights that inspire his audience to deepen their understanding of the financial world.
Disclosure: The writer and his dependents do not hold the stocks discussed in this article.
The website managers, its employee(s), and contributors/writers/authors of articles have or may have an outstanding buy or sell position or holding in the securities, options on securities or other related investments of issuers and/or companies discussed therein. The articles’ content and data interpretation are solely the personal views of the contributors/ writers/authors. Investors must make their own investment decisions based on their specific objectives, resources, and only after consulting such independent advisors as may be necessary.