
Market volatility has rattled investors, particularly those seeing their savings diminish due to uncontrollable circumstances. However, seasoned market observers recognise that such fluctuations are not unusual. Analysis of market trends reveals volatility since September 2024, with a correction anticipated. This suggests sustained market pressure over the past five months. Unsurprisingly, many investors find it challenging to maintain their SIPs during such periods.
Why the Fear?
Many investors struggle to maintain a five-year investment horizon for SIP returns, often investing enthusiastically during bull markets but hastily redeeming units during bearish trends, thus hindering potential profits. A recent Motilal Oswal study suggests that instead of fearing market volatility, investors should maintain their SIPs for at least seven years to maximize returns.
Analysis of Motilal Oswal’s report
Motilal Oswal’s report analyzes 5, 7, and 10-year monthly rolling SIP returns across various indices: Nifty 100, Nifty Mid-Cap 150, Nifty Small-Cap 250, and Nifty 500 Multicap 50:25:25. The analyzed period encompasses significant market events, including the 2008-2009 financial crisis, the 2013 sell-off, and the pandemic.
The data clearly demonstrates that long-term investors who maintained their SIPs throughout these crises achieved positive returns. The report indicates that a 7 to 10-year investment horizon significantly reduces the risk of losses across small-cap, mid-cap, and large-cap indices.
7-Year SIP Performance:
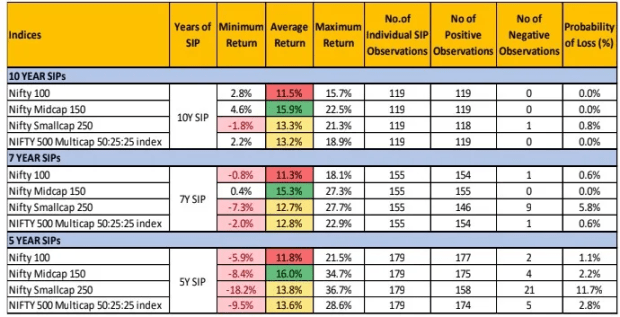
Nifty 100: The worst annual return was -0.8%, the average return was 11.3%, and the best return was 18.1%. The probability of loss over a 7-year period was 0.6%.
Nifty Mid-Cap 150: The worst annual return was 0.4%, the average return was 15.3%, and the best return was 27.3%. There was a 0.0% probability of loss over 7 years.
Nifty Small-Cap 250: The worst annual return was -7.3%, the average return was 12.7%, and the best return was 27.7%. The probability of loss over 7 years was 5.8%.
NIFTY 500 Multicap 50:25:25: The worst annual return was -2.0%, the average return was 12.8%, and the best annual return was 27.9%. The probability of loss over 7 years was 0.6%.
10 years SIP
Nifty 100: For 10 years the Nifty 100 showed the worst performance with 2.8 per cent of returns. The average return was 11.5 per cent with the best returns of 15.7 per cent. The chance for the loss was 0.0 per cent for 10 years.
Nifty Mid-Cap 150: The 10 years of the Nifty Mid-cap 150 index witnessed 4.6 per cent as its worst return. Meanwhile, the average return stood at 15.9 per cent and the best return stood at 22.5 per cent. The chance for the loss was 0.0 per cent.
Nifty Small-Cap 250: The Small-cap 250 index saw a -1.8 per cent as the worst return. However, the average return stood at 13.3 per cent and the best return stood at 21.3 per cent. The chances for a loss stood at 0.8 per cent.
NIFTY 500 Multicap 50:25:25: The Nifty 500 Multicap 50:25:25 index showed the worst performance with a 2.2 per cent return. However, the average return stood at 13.2 per cent and the best return stood at 18.9 per cent. The chance for the loss was 0.0 per cent for the 10 years.
(Please Note: In this analysis, it is assumed that the SIP starts on the first working day of each month. The returns shown are calculated using the XIRR at the end of the respective SIP period, where the evaluation is based on the first working day of the month following the SIP period.)
What does the analysis suggest?
As there is a lot of concern regarding mid-cap and small-cap, the analysis shows that if you keep an SIP for 7 years, the probability of loss is 0 per cent for the mid-cap category and 5.8 per cent for the small-cap category. If the investment is kept for 10 years, the probability of loss is 0 per cent for mid-cap and 0.8 per cent for small-cap. In 5 years, the probabilities are 2.2 per cent and 11.7 per cent, respectively. Therefore, whether it’s a marriage or a SIP, if you stick with it for the first 7 years, you are generally considered lucky, even if you married an unstable person or invested in a small cap.
What was the performance in the year after the worst year?
For Nifty 100, the worst year in 7 years gave a 0.8 per cent return. However, if investors stayed in their investment instead of withdrawing, without continuing the SIP, they earned a 15.1 per cent return the following year. For Nifty Midcap 150, the worst annual return was 0.4 per cent, but the following year saw a 20.4 per cent return. For Nifty Smallcap 250, the worst return in the 7 years was -7.3 per cent, but the next year the category gave a 14.8 per cent return. Similarly, for Nifty 500 Multicap 50:25:25, the worst return over 7 years was -2.0 per cent, but the next year saw a 16.5 per cent return.
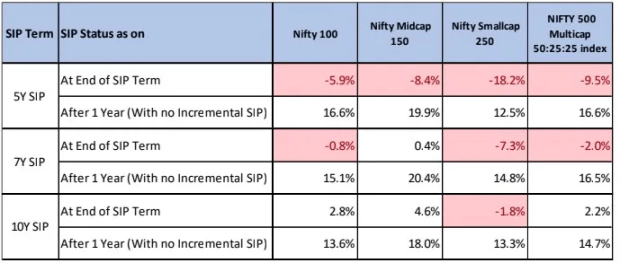
For 10 years, the worst year for Nifty 100 gave a 2.8 per cent return. But if investors remained in their investment without withdrawing and without continuing the SIP, they got a 13.6 per cent return the following year. For Nifty Midcap 150, the worst annual return was 4.6 per cent, but the next year gave an 18 per cent return. For Nifty Smallcap 250, the worst year in the 10 years gave a -1.8 per cent return, but the next year the category delivered a 13.3 per cent return. Similarly, for Nifty 500 Multicap 50:25:25, the worst year over 10 years gave a 2.2 per cent return, but the following year saw a 14.7 per cent return.
Note: There is no guarantee that the past performance of any index or equity fund will continue in the future. It may or may not remain consistent. Since there is market risk, it is advisable to consult an expert before making any investments.