

The market is inherently cyclical, moving between euphoria and fear, optimism and correction. This cycle sees a shift from high optimism and rising prices to profit booking and corrections. In 2025 too, we find ourselves in the midst of such a correction phase, with market participants feeling the weight of recent downtrends. However, the key to successful trading and investing during such times is not to chase underperformers but to focus on stocks that continue to outperform or demonstrate long-term strength.
One strategy for identifying these winning stocks is the Bold Bulls strategy, which focuses on identifying stocks showing strong bullish trends even during market corrections. The key tool in this strategy is the Relative Strength Index (RSI). Let us first understand RSI and how it helps investors spot “Bold Bulls.”
Understanding the RSI as a trend indicator
The Relative Strength Index (RSI) is a momentum oscillator that measures the speed and change of price movements. It ranges from 0 to 100 and is typically used to identify overbought or oversold conditions in a market. An RSI above 70 generally indicates that a stock is overbought, while an RSI below 30 suggests it is oversold. For the Bold Bulls strategy, however, we focus on the trend’s strength.
An RSI above 60 on monthly, weekly, and daily charts signals a strong bullish trend, with higher values indicating stronger momentum.
The advantage of using RSI on monthly, weekly, and daily charts
RSI is more than just a short-term momentum indicator. Using it across multiple timeframes (monthly, weekly, and daily) gives us a holistic view of a trend’s strength.
- Monthly RSI: A strong monthly RSI above 60 indicates long-term strength and potential for sustained growth.
- Weekly RSI: A weekly RSI above 60 signals momentum and strength in the medium-term trend.
- Daily RSI: A daily RSI above 60 suggests strong short-term momentum, making it useful for traders looking to capitalise on immediate opportunities.
When a stock shows a strong RSI across these three timeframes, it stands out as a Bold Bull with robust long-term and medium-term trends and strong short-term momentum.
Three stocks that qualify for the Bold Bulls Strategy
Based on the RSI criteria, we have identified three stocks that exhibit strong bullish trends, making them great candidates for the Bold Bulls strategy.
1. Avanti Feeds
Avanti Feeds is a leading player in the Indian aquaculture industry. It is primarily engaged in the manufacturing of shrimp feed and fish feed and the processing of shrimp. The company is known for its established market position and consistently growing revenue base.
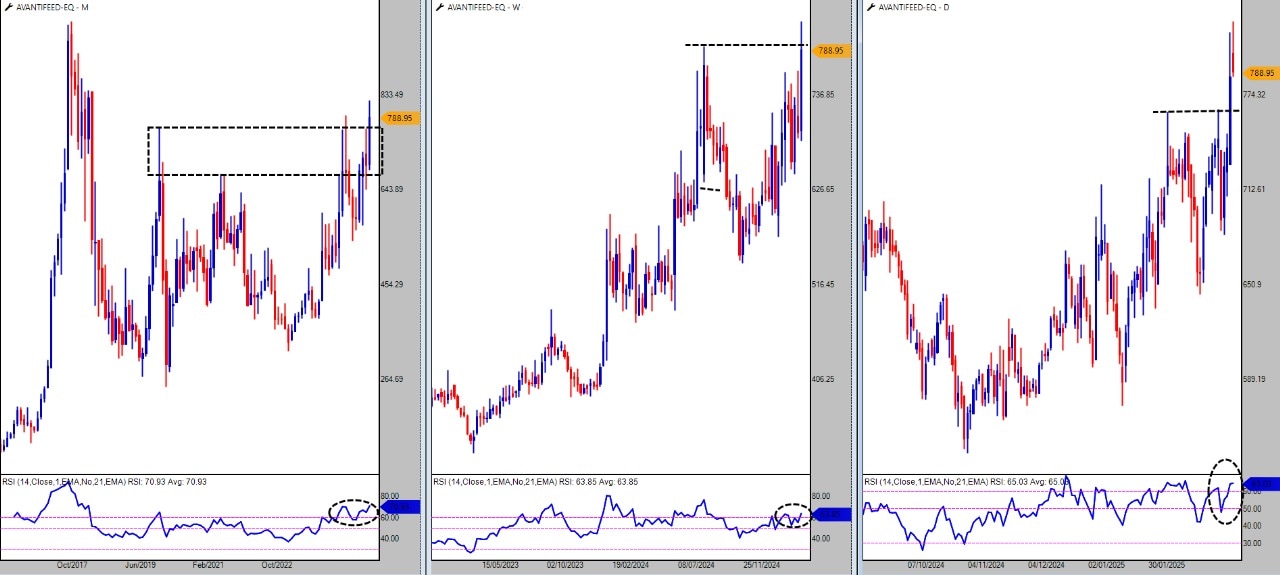
Avanti Feeds has been displaying a clear bullish trend, as evidenced by its breakout from a major resistance zone on the charts. This breakout indicates that the stock is moving higher and attracting buying momentum. The RSI across the monthly, weekly, and daily charts confirms this strength, with readings above 60, signalling potential bullish trends across all timeframes.
Chambal Fertilisers is a prominent player in the Indian fertiliser industry. It primarily focuses on manufacturing and distributing urea and other fertilisers. The company has a wide distribution network is recognised for its high-quality products.
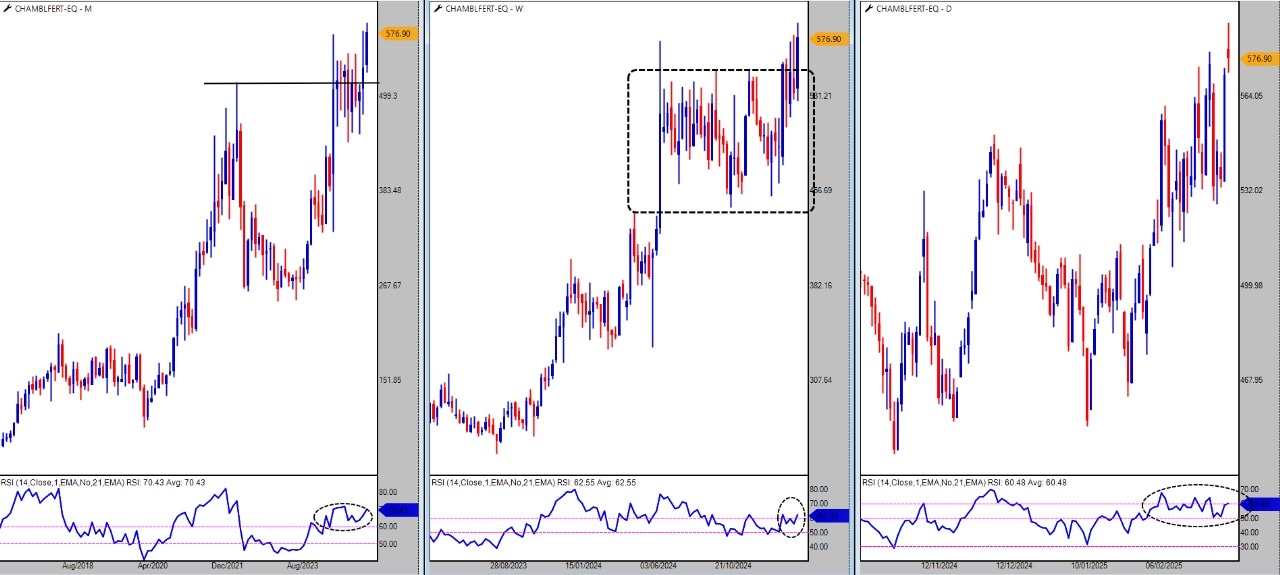
Chambal Fertilisers has been displaying strong bullish characteristics, which is especially evident from its price action on the charts. The stock broke through previous resistance levels, retested them, and resumed its upward trajectory. This retest and continuation pattern suggests that the bulls are in control.
Additionally, the breakout on the weekly chart points toward a potential rally towards all-time highs, reinforcing the strength of its bullish trend. The RSI across all timeframes above 60 further confirms that Chambal Fertilisers is in a potential sustainable uptrend.
3. Narayana Hrudayalaya Ltd. (NH)
Narayana Hrudayalaya Ltd. (NH) is a renowned healthcare provider in India. It specialises in heart care, multi-speciality hospitals, and outpatient services. The company has been at the forefront of providing affordable healthcare and is known for its network of hospitals across India.
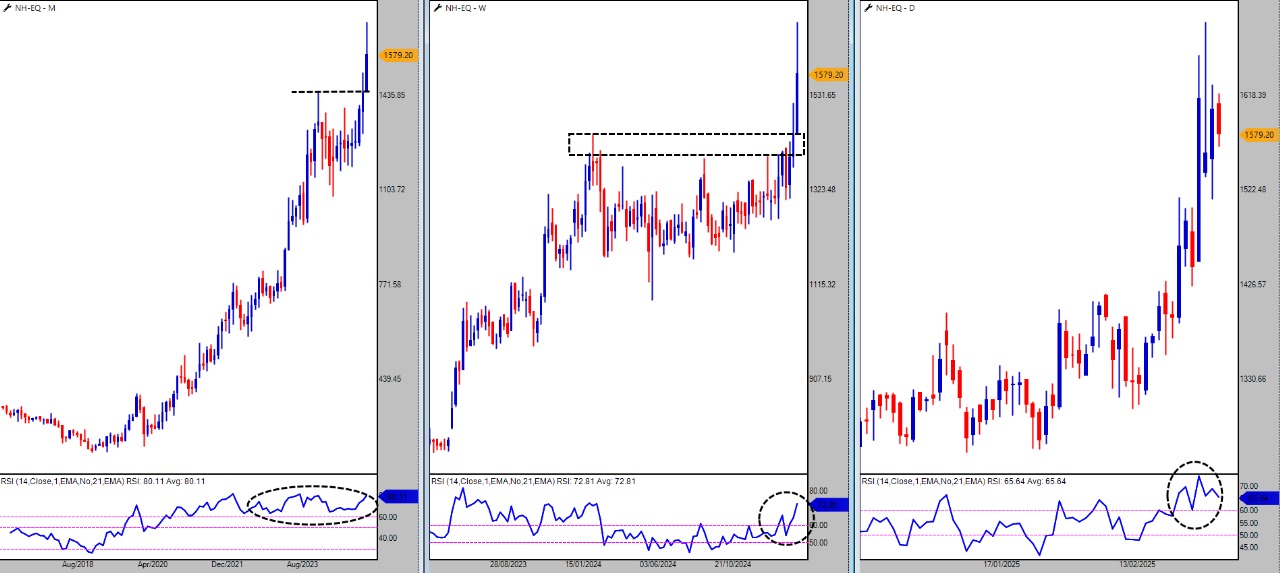
NH has recently hit an all-time high in March 2025, demonstrating remarkable outperformance compared to benchmark indices like the Nifty50 and Nifty500.
The stock price breaking out from previous resistance zones further confirms its bullish trend. The RSI readings on the monthly, weekly, and daily charts, all staying above the 60 mark, highlight a robust trend and momentum, signalling that the stock may potentially continue its upward trajectory.
Are you a BOLD BULL?
While the broader market may experience corrections, stocks that demonstrate strong bullish trends and momentum will continue to thrive. Investors can identify those with sustainable strength during market corrections by focusing on stocks with RSI readings above 60 on multiple timeframes. Avanti Feeds, Chambal Fertilisers, and Narayana Hrudayalaya Ltd. are potential examples of stocks that qualify as Bold Bulls, offering strong potential for investors looking for growth even in a corrective market phase.
Disclaimer
Note: We have relied on data from http://www.definedgesecurities.com throughout this article. Only in cases where the data was unavailable have we used an alternate but widely used and accepted source of information.
The purpose of this article is only to share interesting charts, data points and thought-provoking opinions. It is NOT a recommendation. If you wish to consider an investment, you are strongly advised to consult your advisor. This article is strictly for educative purposes only.
Brijesh Bhatia has over 18 years of experience in India’s financial markets as a trader and technical analyst. He has worked with UTI, Asit C Mehta, and Edelweiss Securities. Presently, he is an analyst at Definedge.
Disclosure: The writer and his dependents do not hold the Stocks discussed in this article. However, clients of Definedge may or may not own these securities.
The website managers, its employee(s), and contributors/writers/authors of articles have or may have an outstanding buy or sell position or holding in the securities, options on securities or other related investments of issuers and/or companies discussed therein. The articles’ content and data interpretation are solely the personal views of the contributors/ writers/authors. Investors must make their own investment decisions based on their specific objectives, resources and only after consulting such independent advisors as may be necessary.