")
Smart investors are always on the lookout for stocks that have a strong hold on their debt and a high return on capital employed (ROCE). A low debt-to-equity implies that a company is using less leverage and has a stronger equity position. While a high ROCE shows how efficient is the company in turning capital used into profits.
Both are key metrics used to gauge a company’s financial health and how it funds its operations. This combination, especially in volatile markets, garners significant investor attention as they look more stable and capable of making some solid returns for investors.
So, for anyone who is looking for growth combined with possible stability, these selections represent areas of interest for growth-oriented investors. Let us look at 2 lesser-known chemical companies, which have aced the formula for this combination.
The China Pivot: A Structural Tailwind for India
Before we dive into the companies, one must know that the outlook for Indian specialty chemicals is currently bolstered by China’s pivot to curb “involution”. Which means its destructive overcapacity and predatory pricing that historically suppressed global margins. As Beijing shifts toward industrial discipline, a more rational pricing environment is emerging, providing a structural tailwind for lean, high-ROCE Indian producers.
This transition, coupled with the “China+1” strategy, allows debt-free domestic players to capture and expand global market share with significantly enhanced pricing power.
Along with that, what makes this perhaps the right time to analyse is that the stock prices of the companies we are about to discuss have taken a knock in the last one month.
Supreme Petrochem: Dominating The Market with 50% Market Share
Incorporated in 1989, Supreme Petrochem Limited, promoted by Supreme Industries (SIL) and R Raheja Investments, is in the business of Styrenics and manufactures Polystyrene (PS), Expandable Polystyrene (EPS), Masterbatches and Compounds of Styrenics and other Polymers, Extruded Polystyrene Insulation Board (XPS) and Styrene Methyl Methacrylate (SMMA).
With a market cap of Rs 9,885 cr, the company is a leader in the domestic Polystyrene and Expanded Polystyrene market, holding a 50% market share. It is the first and only producer of XPS Boards in India.
The Efficiency Engine: ROCE vs. Peers
The company’s 5-year average ROCE is 44% while the industry median when compared to peers for the same period is just 21%. In simple words, in the last 5 years, while peers, on average, generated a profit of Rs 21 on every Rs 100 used as capital, Supreme Petrochem beat them all with more than double at Rs 44.
In addition, the company’s current debt-to-equity ratio is 0.06, which means that the company is virtually debt free. For every Rs 100 of its own money (Equity), the company has borrowed only Rs 6. In a market like India, where interest rates for corporate loans can be relatively high (often between 9% and 12%), having such low debt is a big competitive advantage.
Let us look at the financials as well to see if the company has the same strong hold on other aspects. We will be looking at standalone numbers to get a long-term perspective.
The company’s sales grew at a compounded rate of 17% from Rs 2,724 cr in FY20 to Rs 6,023 cr in FY25.
For the 3 quarters of FY26 up to December 2025, the company has logged sales of Rs 3,752 cr, which is 16% lower than the figure of Rs 4,484 cr for the same 3 quarters the previous year.
Earnings before interest, taxes, depreciation, and amortization (EBITDA) was Rs 148 cr in FY20 which grew to Rs 535 cr in FY25, logging a compound growth of 30%. For the current year so far, the EBITDA logged was Rs 262 cr implying that even as revenues fell, operating margins appear to have improved.
The net profits also grew from Rs 103 cr to Rs 391 cr between FY20 and FY25, recording a compounded growth of 29%. By the end of Q3FY26, the profits logged by the company were Rs 159 cr, a drop of 44% from the figure of 283 cr for the same 3 quarters for FY25.
The share price of Supreme Petrochem Ltd was around Rs 180 in January 2021 and as on 28th January 2026 it was Rs 525, which is a 192% jump in 5 years.

At the current price of Rs 525, the stock is trading at a discount of 47% from its all-time high of Rs 982. Over the last month, the stock is down about 20%.
As for valuations, the company’s share is trading at a price to earnings (PE) multiple of 36 and the industry median currently is 17x. The median PE of Supreme for the last 10 years is 22x, while the industry median for the same period is 13x.
The company also has a current dividend yield of 1.9% while the industry average is hardly 0.5%, and the company has been maintaining a healthy dividend payout of 47%.
While the financials for the three quarters of FY26 (up to December 2025) have shown a drop on a YoY basis, the company’s CFO Rakesh Nayyar said in the recent earnings call that, “The volumes and margins were impacted due to extended monsoon leading to lower demand for cooling devices such as air conditioners and refrigerators, deferment of purchases due to advance intimation of GST rate reduction, subdued economic activity across major economies, and change in trade flows due to trade barriers.”
He also added, “The 3rd Quarter starts picking up only towards the end of November or December. We should be able to recover.”
Tanfac Industries: The Fluorine Chemical Powerhouse
Incorporated in 1972, Tanfac Industries Ltd is amongst the leading producers of Hydrofluoric Acid and its derivatives.
With a market cap of Rs 3,850 cr, Tanfac is a Joint Venture Company promoted by Anupam Rasayan India Limited and the Tamil Nadu Industrial Development Corporation Limited (TIDCO). It is India’s largest supplier of fluorine chemicals.
The company’s 5-year average ROCE is 45% while the industry median when compared to peers for the same period is 17%.
The company’s current debt-to-equity ratio is 0.09, making it virtually debt free like Supreme Petrochem above.
The Financial Stress Test: Sales & Margins
Let us dive into the financials to see if the company has what it takes to sustain these figures.
The company’s sales grew at a compounded rate of 28% from Rs 165 cr in FY20 to Rs 557 cr in FY25. For the 3 quarters of FY26 up to December 2025, the company has logged sales of Rs 518 cr already, implying significant growth.
EBITDA grew from Rs 27 cr in FY20 to Rs 131 cr in FY25, logging a compound growth of 37%. By the end of Q3FY26, the EBITDA logged was Rs 82 cr.
The net profits went from Rs 17 cr to Rs 88 cr between FY20 and FY25, logging a compounded growth of 39%. By the end of Q3FY26, the profits logged by the company were Rs 52 cr.
The share price of Tanfac Industries Ltd was around Rs 185 in January 2021 and as on 28th January 2026 it was Rs 3,860, which is a jump of almost 1,990% in 5 years.
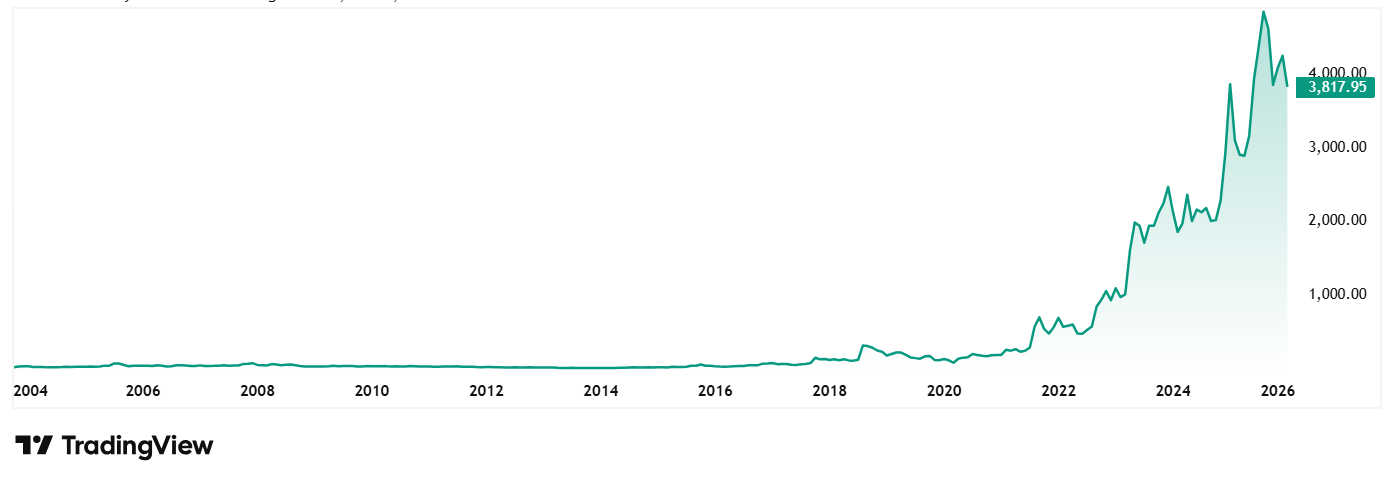
At the current price of Rs 3,860, the stock is trading at a discount of 24% from its all-time high of Rs 5,064. Over the last one month the stock is down about 6%.
The company’s share is trading at a PE of 51 and the industry median currently is 18x. The median PE of Tanfac for the last 10 years is 15x, while the industry median for the same period is 14x.
The company has recently seen a change in leadership with Afzal Malkani taking over as the new Managing Director. In January 2026, the company has signed a 7-year supply contract for 7,500 TPA fluorinated chemicals to a Japanese client, valued at Rs 337.5 cr per year, effective 1 Jan 2027. This provides long term revenue visibility backed by committed volumes.
The Verdict: Stability in Volatility?
Finding companies that have the combination of high return on capital with a near-allergic reaction to debt is rare. Especially in the capital-intensive chemical sector. However, both Supreme Petrochem and Tanfac Industries have demonstrated that they don’t need massive leverage to log solid results; instead, they rely on operational efficiency and market dominance.
While Supreme Petrochem is currently weathering a short-term storm of “monsoon-led” demand dips and GST shifts, its 44% 5-year average ROCE suggests the engine under the hood is rock solid. On the other hand, Tanfac’s huge 5-year run, and its fresh 7-year supply contract provide a level of revenue visibility that most small-caps would envy.
But quality rarely comes cheap. With both stocks trading at P/E multiples significantly higher than the industry median, the question for investors isn’t just about the strength of the balance sheet, but whether the current discount from all-time highs represents a value entry or a correction toward historical norms.
Disclaimer:
Note: We have relied on data from www.Screener.in throughout this article. Only in cases where the data was not available, have we used an alternate, but widely used and accepted source of information.
The purpose of this article is only to share interesting charts, data points and thought-provoking opinions. It is NOT a recommendation. If you wish to consider an investment, you are strongly advised to consult your advisor. This article is strictly for educative purposes only.
Suhel Khan has been a passionate follower of the markets for over a decade. During this period, He was an integral part of a leading Equity Research organisation based in Mumbai as the Head of Sales & Marketing. Presently, he is spending most of his time dissecting the investments and strategies of the Super Investors of India.
Disclosure: The writer and his dependents do not hold the stocks discussed in this article.
The website managers, its employee(s), and contributors/writers/authors of articles have or may have an outstanding buy or sell position or holding in the securities, options on securities or other related investments of issuers and/or companies discussed therein. The content of the articles and the interpretation of data are solely the personal views of the contributors/ writers/authors. Investors must make their own investment decisions based on their specific objectives, resources and only after consulting such independent advisors as may be necessary.