

By Brijesh Bhatia
As the calendar flipped to 2025, fear gripped the heart of D-street, much like it does at the start of every new year. January has long been a notoriously volatile month for Indian markets, and this year is no exception. The Nifty50 has been riding a choppy wave of negative sentiment.
But as we dig deeper, is there a silver lining ahead for investors? Or is this a precursor to a prolonged bearish phase?
Before diving into chart analysis and picking potential winners from the Nifty50, let us first explore the seasonality trends that have defined the Indian stock market over the years.
Seasonality: A Battle Between Bulls and Bears
Looking at the performance of the Nifty50 index from 1996 to 2024, January hasn’t been kind to investors. The average return during the month is a modest -0.23%, with the bears reigning supreme. January tends to usher in cautious market behaviour as traders prepare for the new year with mixed expectations.

Source: RZone, Definedge Securities
That said, historical trends show a pattern where the market tends to enter an accumulation phase by mid-January, setting the stage for potential positive returns in the months ahead.
If history is anything to go by, the second half of January into February often shows an uptick, suggesting that the next few weeks might hold promise for long-term investors.
But does the chart back this theory?
Let us analyse the Nifty50 chart more closely and assess whether it’s time to prepare for a market reversal or a deeper correction.
Nifty Weekly Chart
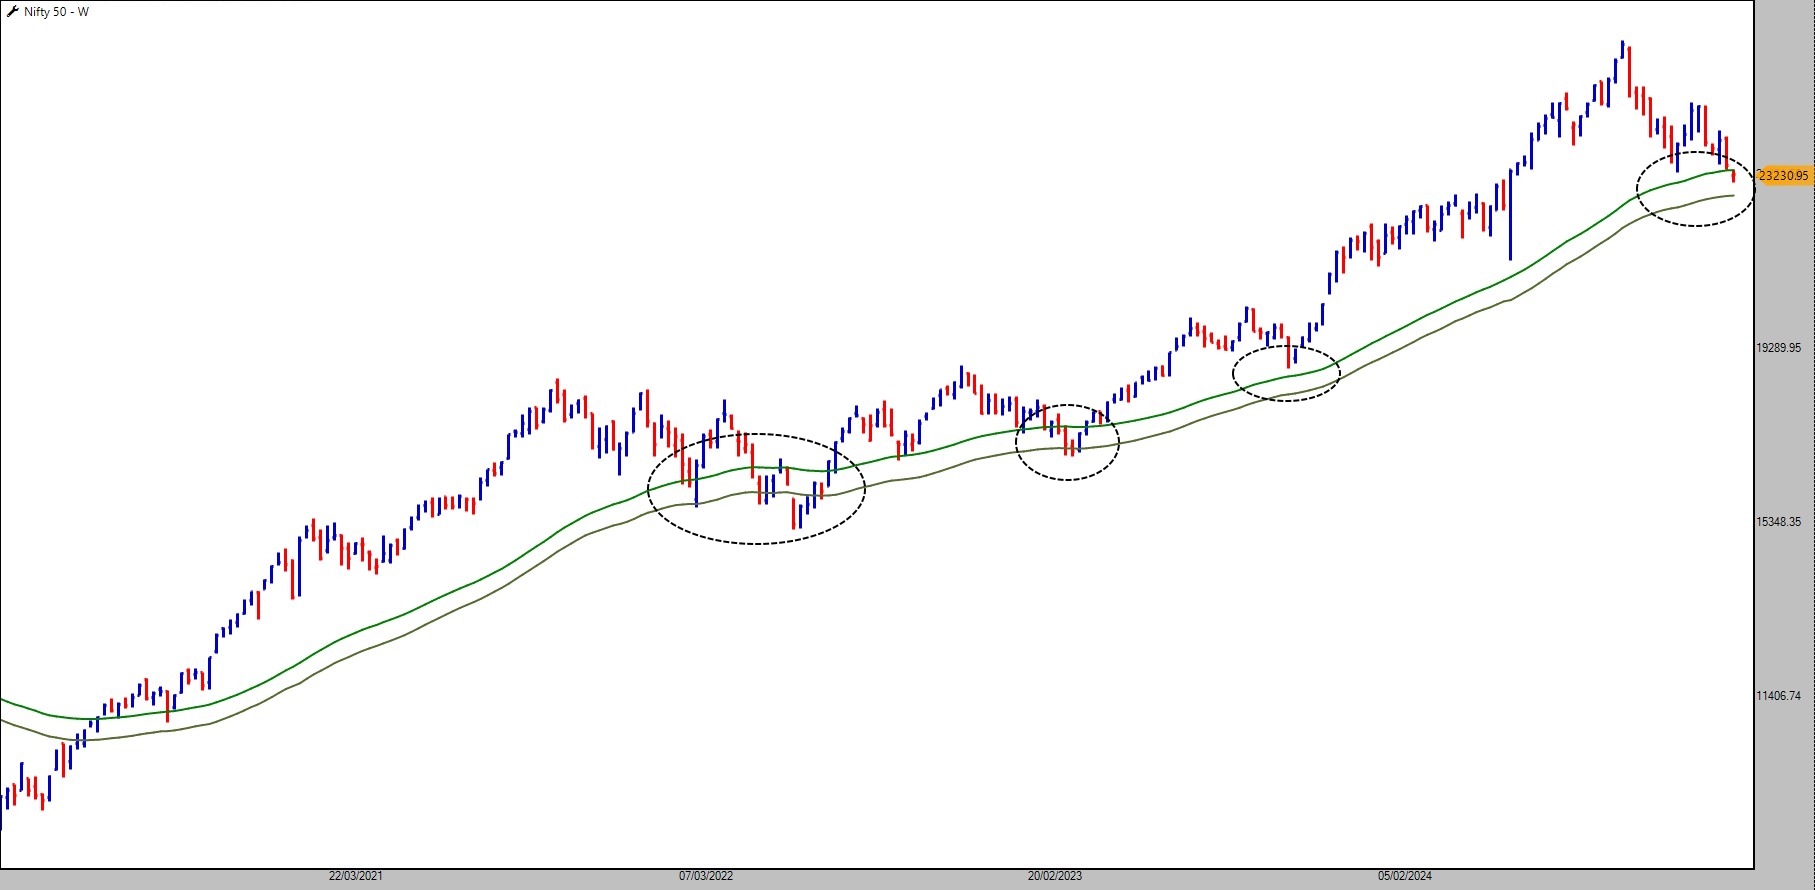
Source: TradePoint, Definedge Securities
When we turn to the Nifty weekly chart, a fascinating technical pattern emerges. The index has entered a crucial support zone, formed by the 62-week Exponential Moving Average (62WEMA) channel. This zone, ranging between 22,700 and 23,200, has historically been a strong area for reversals. The 62WEMA (High) and 62WEMA (Low) lines have been effective guides since 2020, with every dip into this zone being followed by a reversal toward new highs.
But while the broader Nifty50 index is at a critical juncture, let us analyse some individual stocks that could shine if the market reverses course.
Reliance Industries, the behemoth of India’s corporate, had a rough 2024. The stock underperformed the Nifty50 and currently hovers near its 52-week low. Despite this, the chart shows signals that suggest a potential turnaround in 2025.
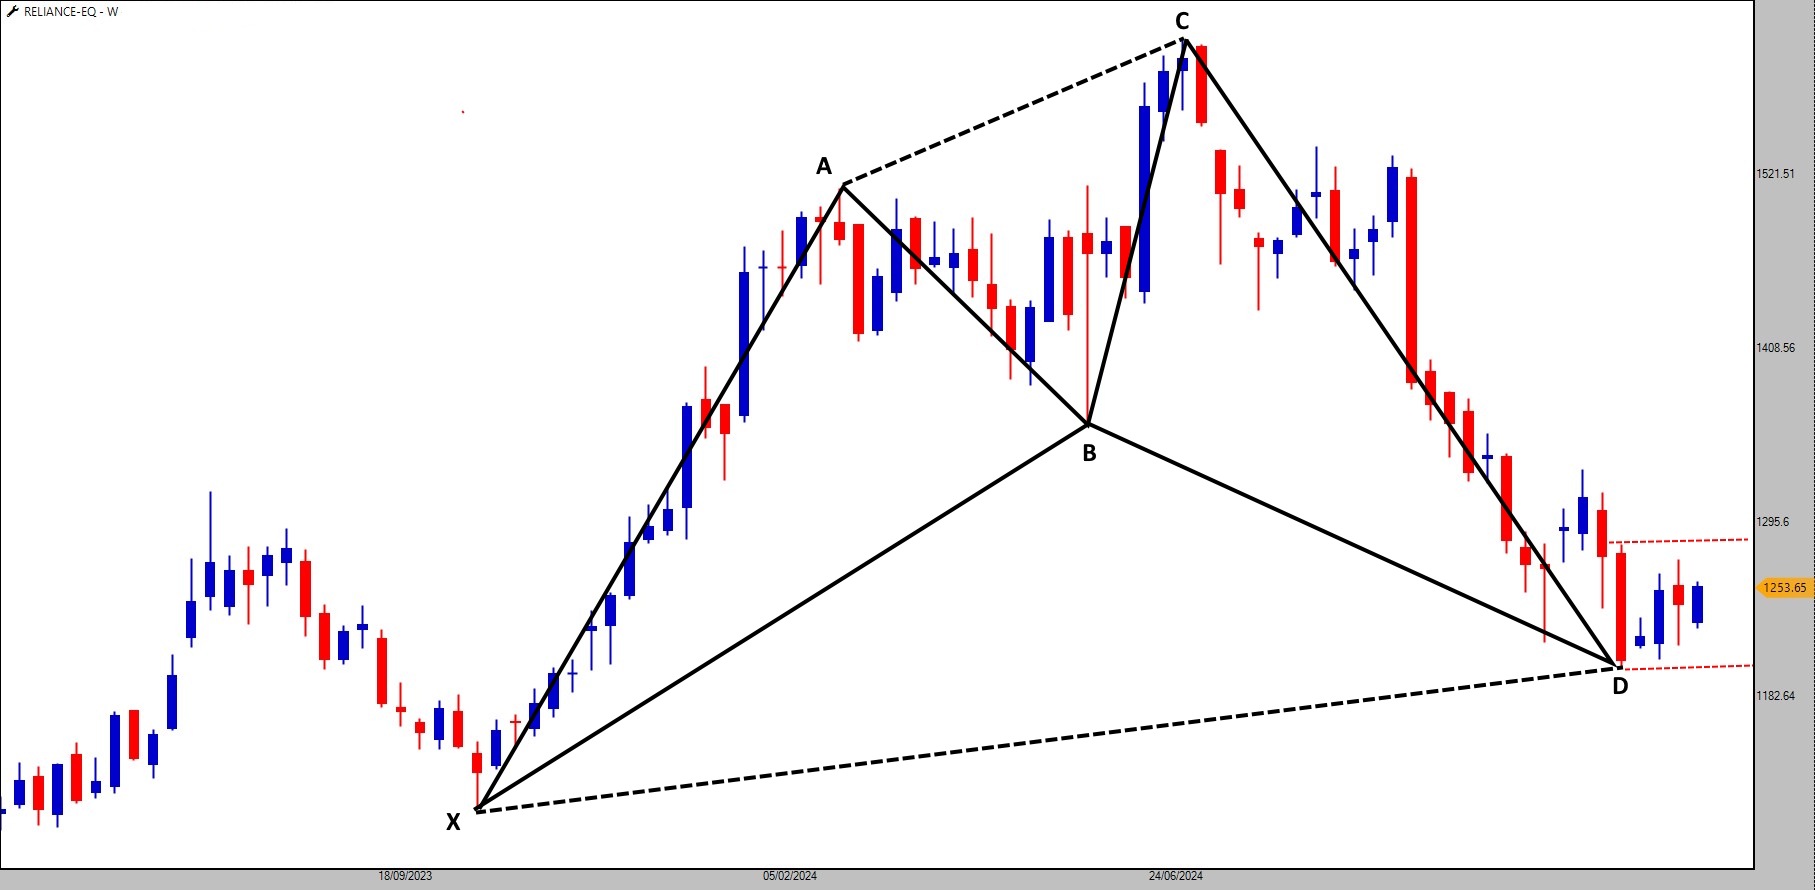
Source: TradePoint, Definedge Securities
On the weekly chart, a Bullish Cypher harmonic pattern has emerged. For traders familiar with harmonic analysis, this pattern suggests a high probability of a reversal, marking the end of a bearish phase. The pattern typically signals an imminent shift in market sentiment.
Despite Nifty50’s 2% drop in January so far, Reliance has managed to stay in the green, rising around 3% during the same period. This outperformance in the face of a broader market downturn signals a potential leader if the market rebounds.
The mid-December weekly candle marked what could be the selling climax. If the stock crosses the Rs. 1,281 level, it would confirm the reversal. A sustained break above Rs. 1,300, especially around the 200WEMA, could potentially trigger a fresh bullish momentum, which might pull the Nifty50 higher as well.
2. BSE
The Bombay Stock Exchange (BSE), a foundational pillar of India’s capital markets, has been showing signs of strength. Despite the broader market weakness, BSE has been bucking the trend.
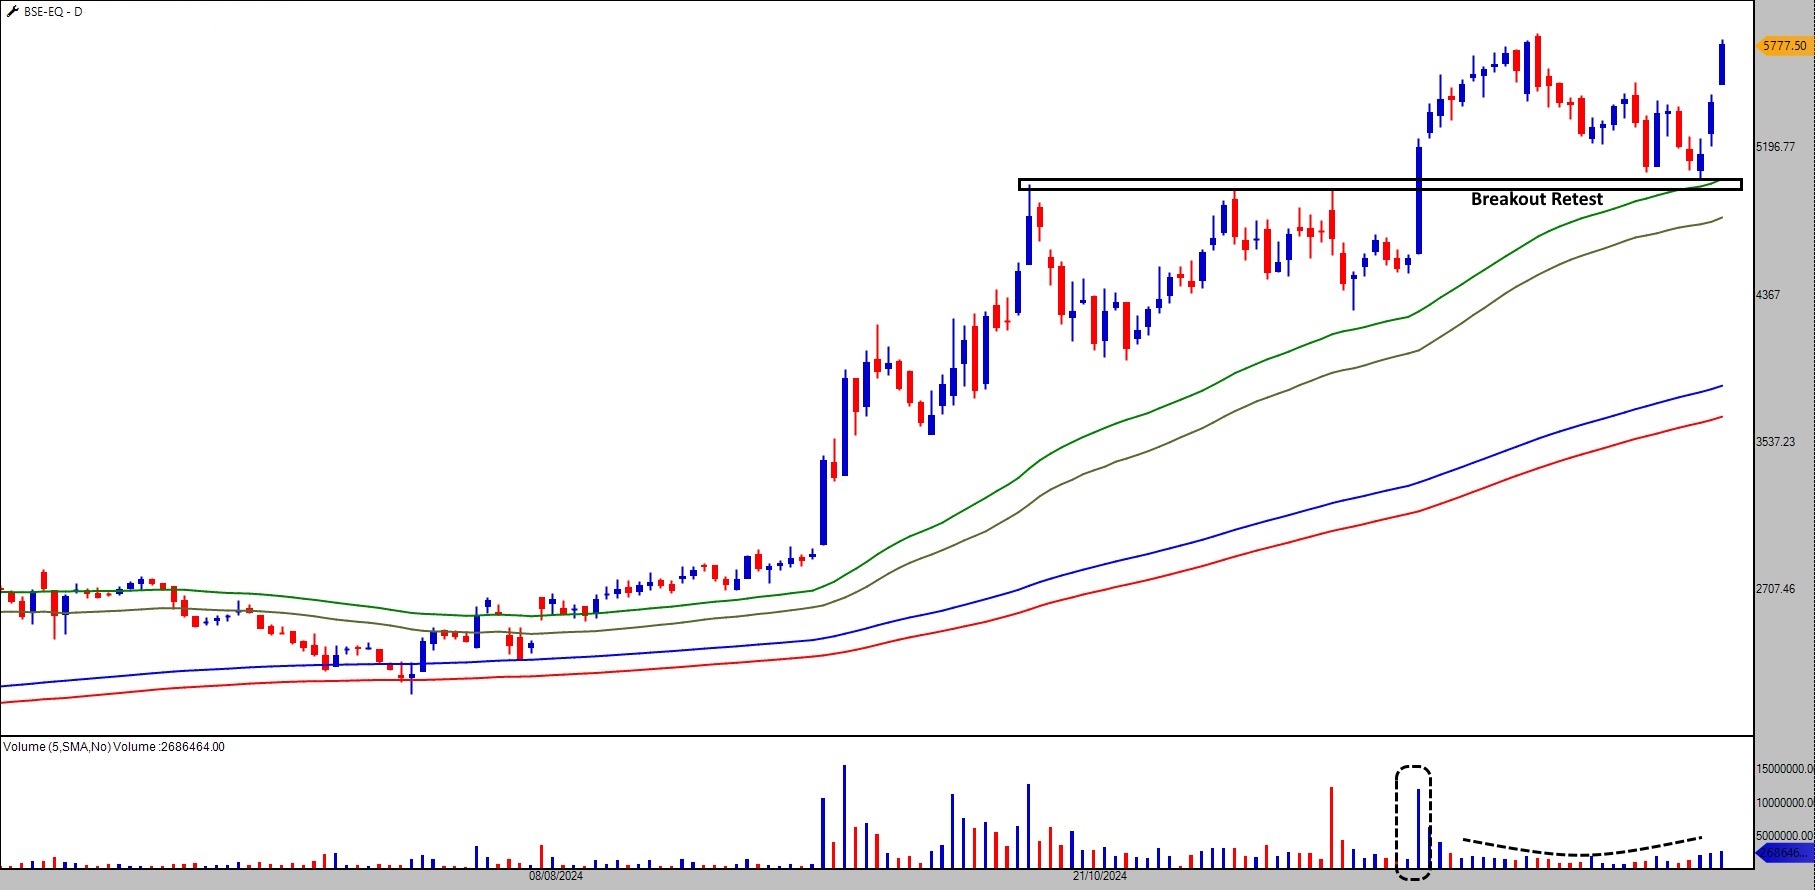
Source: TradePoint, Definedge Securities
A significant breakout occurred in December when the BSE share price broke through the Rs. 5,000 barrier, accompanied by a surge in volume. In technical analysis, volumes validate price movements, and this breakout with higher volumes is a positive indicator of sustained upward momentum.
The price correction that followed the breakout, with BSE dipping to Rs. 5,023, is typical of healthy consolidation after a sharp move. With prices starting to rise again, this suggests that the bulls are firmly in control. If the stock continues its upward trajectory, BSE could potentially hit new highs, making it a strong pick for the watchlist.
Eicher Motors, known for its flagship brand Royal Enfield, has witnessed a remarkable rally in previous years. Something intriguing is happening on the chart right now.
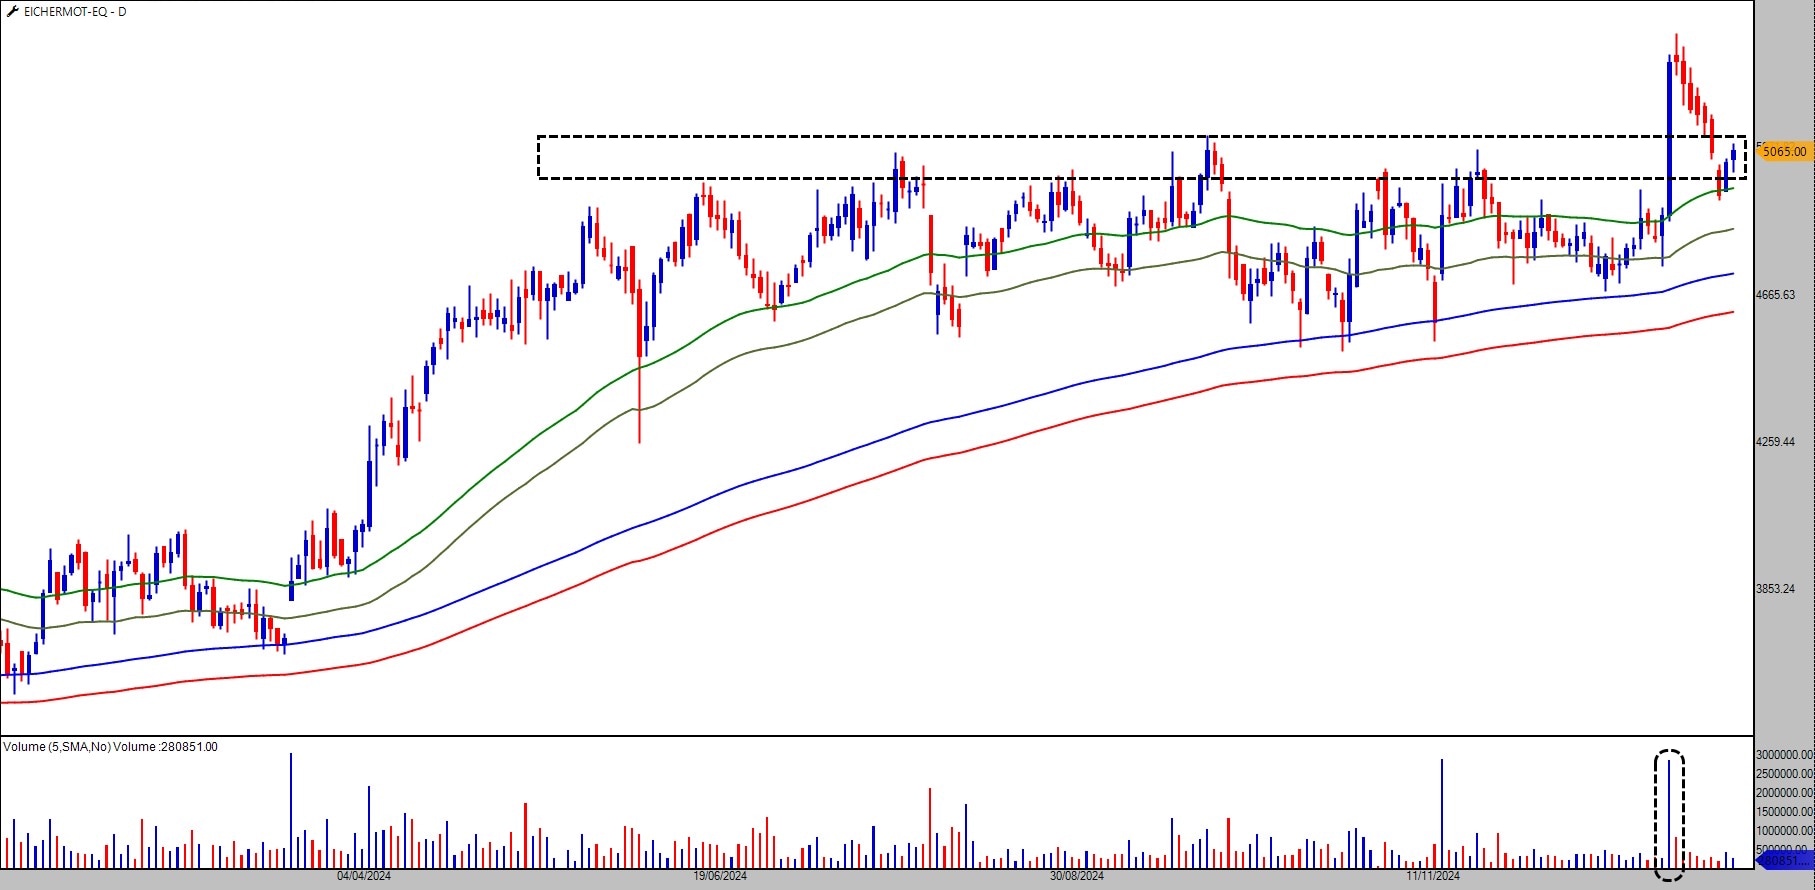
Source: TradePoint, Definedge Securities
The Eicher share price broke out earlier, but the recent retracement was accompanied by a lack of significant volumes, signalling that the selling pressure may not be as strong as it appears. The bullish breakout volumes from earlier are significantly higher than the retracement volumes, which suggests that the momentum is still with the bulls.
If the broader market stabilises and positive sentiment returns, Eicher Motors could continue its upward trajectory, especially with volumes confirming the strength of the bullish trend. The stock is potentially attractive for readers looking for long-term growth in the two-wheeler space.
The Risks: Fear and Volatility Lurk Ahead
While the prospects for certain stocks may seem promising, readers need to tread carefully. The fear and uncertainty prevailing in the market are not unfounded. The quarterly earnings season is underway, and the possibility of disappointing results could add to the market volatility.
In addition, with the Union Budget just around the corner, markets are likely to witness heightened volatility as expectations and speculations swirl.
Any sustained bearish pressure on D-street could jeopardise the setups and stock-specific bullish trends we have discussed. Thus, while accumulation may be an enticing strategy, it is crucial to remain prepared for potential market swings.
Disclaimer
Note: We have relied on data from www.definedgesecurities.com throughout this article. Only in cases where the data was not available, have we used an alternate, but widely used and accepted source of information.
The purpose of this article is only to share interesting charts, data points and thought-provoking opinions. It is NOT a recommendation. If you wish to consider an investment, you are strongly advised to consult your advisor. This article is strictly for educative purposes only.
Brijesh Bhatia has over 18 years of experience in India’s financial markets as a trader and technical analyst. He has worked with the likes of UTI, Asit C Mehta, and Edelweiss Securities. Presently he is an analyst at Definedge.
Disclosure: The writer and his dependents do not hold the stocks discussed in this article. However clients of Definedge may or may not own these securities.
The website managers, its employee(s), and contributors/writers/authors of articles have or may have an outstanding buy or sell position or holding in the securities, options on securities or other related investments of issuers and/or companies discussed therein. The content of the articles and the interpretation of data are solely the personal views of the contributors/ writers/authors. Investors must make their own investment decisions based on their specific objectives, resources and only after consulting such independent advisors as may be necessary.