")
For the first time ever, domestic institutional investors (DIIs) surpassed their foreign counterparts in the stakeholding race. As of 31st December 2025, DIIs held around 24.8% of the equity benchmark index Nifty 50, while foreign institutional investors (FIIs) held 24.3% of the index, marginally less than DIIs.
However, we all see this coming as the participation of DIIs only grew stronger with each passing quarter, while FIIs remained net sellers in 2 of the 3 quarters of FY26.
DIIs infused a total of approximately ₹7,50,000 crore in the calendar year 2025, while FIIs outflows stood at a little over ₹1,50,000 crore for the entire year.
While the overall sentiment of DIIs and FIIs towards the market seems to be poles apart, there are select stocks that united them during Q3FY26. Here in this article, we will explore the five such stocks where they increased their stake significantly.
High-Conviction Plays: Where Big Money is Converging
#1 Utkarsh Small Finance Bank Limited
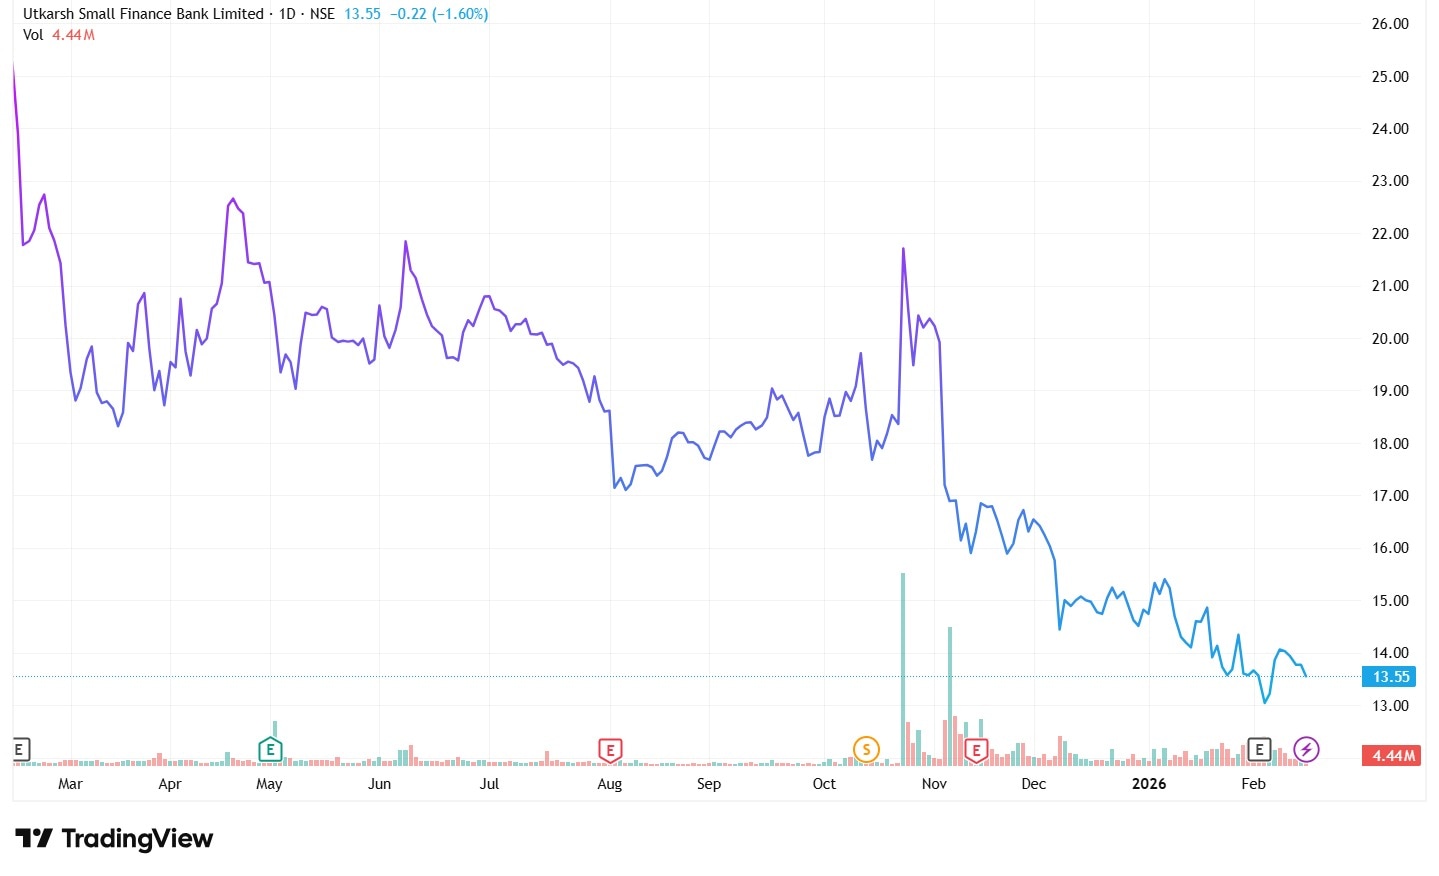
Utkarsh Small Finance Bank Ltd., known for its significant presence in the rural and semi-urban regions, driving financial inclusion for the underpenetrated areas, witnessed 10.1% points rise in FII holding, and 7.35% points increase in DII holding during Q3FY26.
The total FII holding increased to 11.8%, while the total DII holding surged to 9.7% at the end of the quarter. Notably, during the quarter, the bank raised equity capital worth ₹950 crore via a rights issue.
Institutional investors raised their stake in this banking stock despite negative loan book growth and increasing losses.
As of 31st December 2025, the gross loan portfolio stood at ₹18,306 crore, down from ₹19,057 crore as of 31st December 2024, logging a negative growth of 3.9% Year-on-year (YoY).
However, total deposits grew by 4.5% during the same period, from ₹20,172 crore to ₹21,087 crore.
The total revenue fell from ₹932 crore in Q3FY25 to ₹821 crore in Q3FY26, and losses almost doubled during the period from ₹168 crore to ₹375 crore.
Asset quality also declined during the period. The gross non-performing assets (NPA) ratio surged from 6.17% in Q3FY25 to a 11.1% in Q3FY26, and similarly, Net NPA ratio also jumped to 4.48% from 2.5%, which also led the bank to shift its focus from disbursement of loans to collection.
As per management, this negative loan book growth and magnifying losses have been a result of their shift from their Joint liability group (JLG) loans to non-JLG loans, which include retail loans, MSME loans, Micro-banking business loans (MBBL), and others.
The management expects the bank to turn profitable again by FY28, as this transition would lead to a diversified loan portfolio, optimizing returns. As stated by the management, they expect the return on equity (ROE) to again go back to 15% by FY28, which dropped to just 1% as of March 2025.
1-Year Share Price Chart of Utkarsh Small Finance Bank Limited
#2 Ratnaveer Precision Engineering Limited
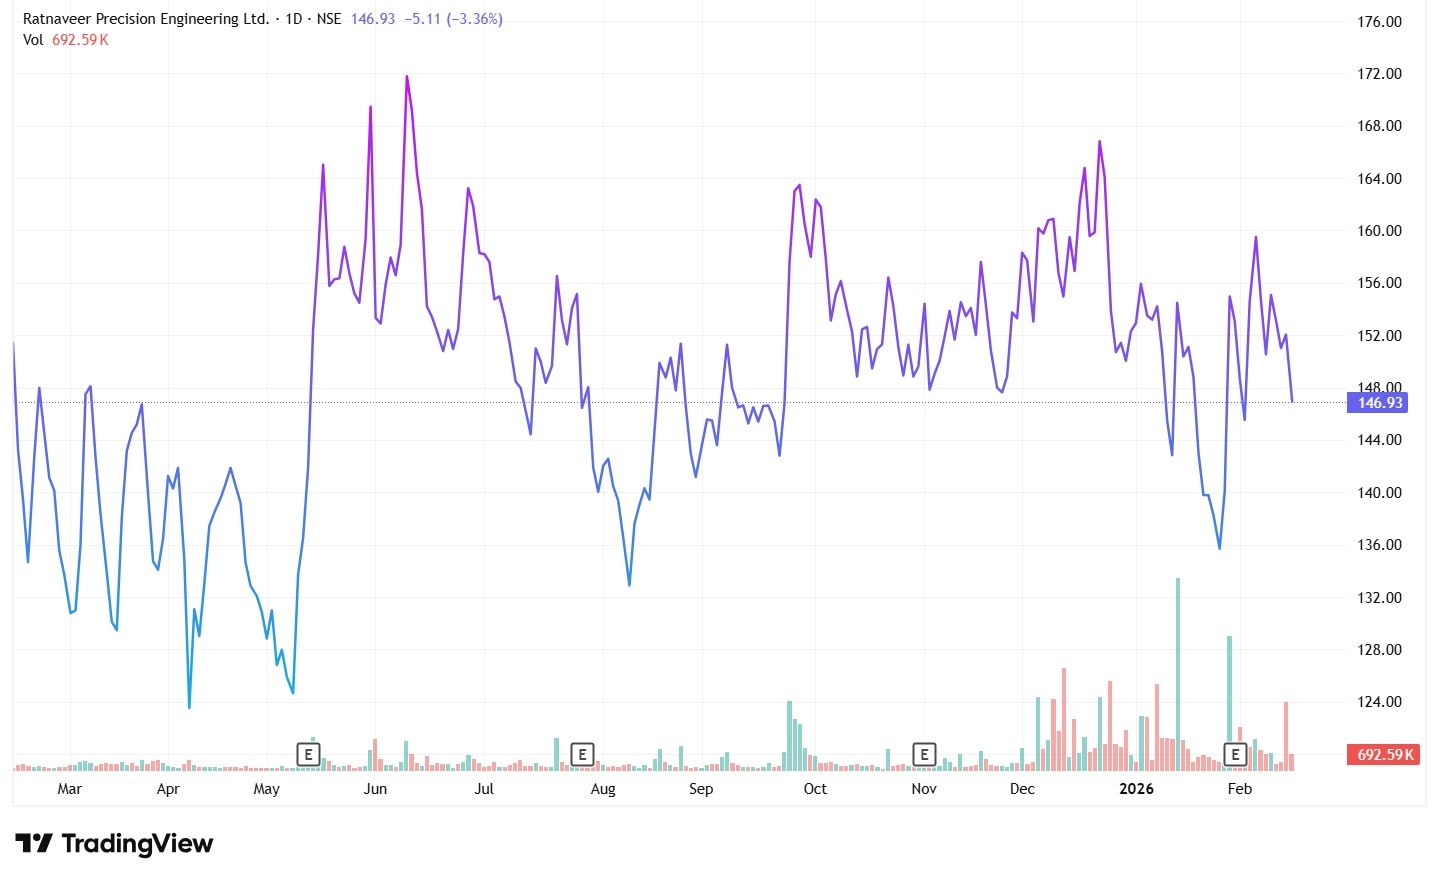
Ratnaveer Precision Engineering Ltd., India’s largest stainless steel washer manufacturer, witnessed FIIs’ stake going up by 7% points and DIIs’ stake rising by 2.5% points during Q3FY26, taking the total FII holding to 8.4% and DII holding to 2.6% at the end of the quarter.
It is to note that during the quarter, the company issued equity shares worth ₹185 crore via a qualified institutional placement.
During the quarter ended on 31 December 2025, sales increased to ₹269 crore, from ₹255 crore during the corresponding quarter of the last fiscal, growing at 5.8% YoY.
But what is more interesting is that from this 5.8% rise in sales, the company generated a 49% YoY growth in its net profit. Profits surged from ₹11 crore to ₹17 crore during the period.
Having said that, it is not just a random quarterly rise. Sales as well as profits are growing steadily over years, which is perhaps a strong reason for attracting institutional investors.
The management expects the topline to be around ₹1,100 crore for the FY26, while for the FY27, they are expecting it to grow up to ₹1,500 crore, and by FY28 to reach ₹1,800 crore.
1-Year Share Price Chart of Ratnaveer Precision Engineering Ltd.
#3 Mphasis Limited
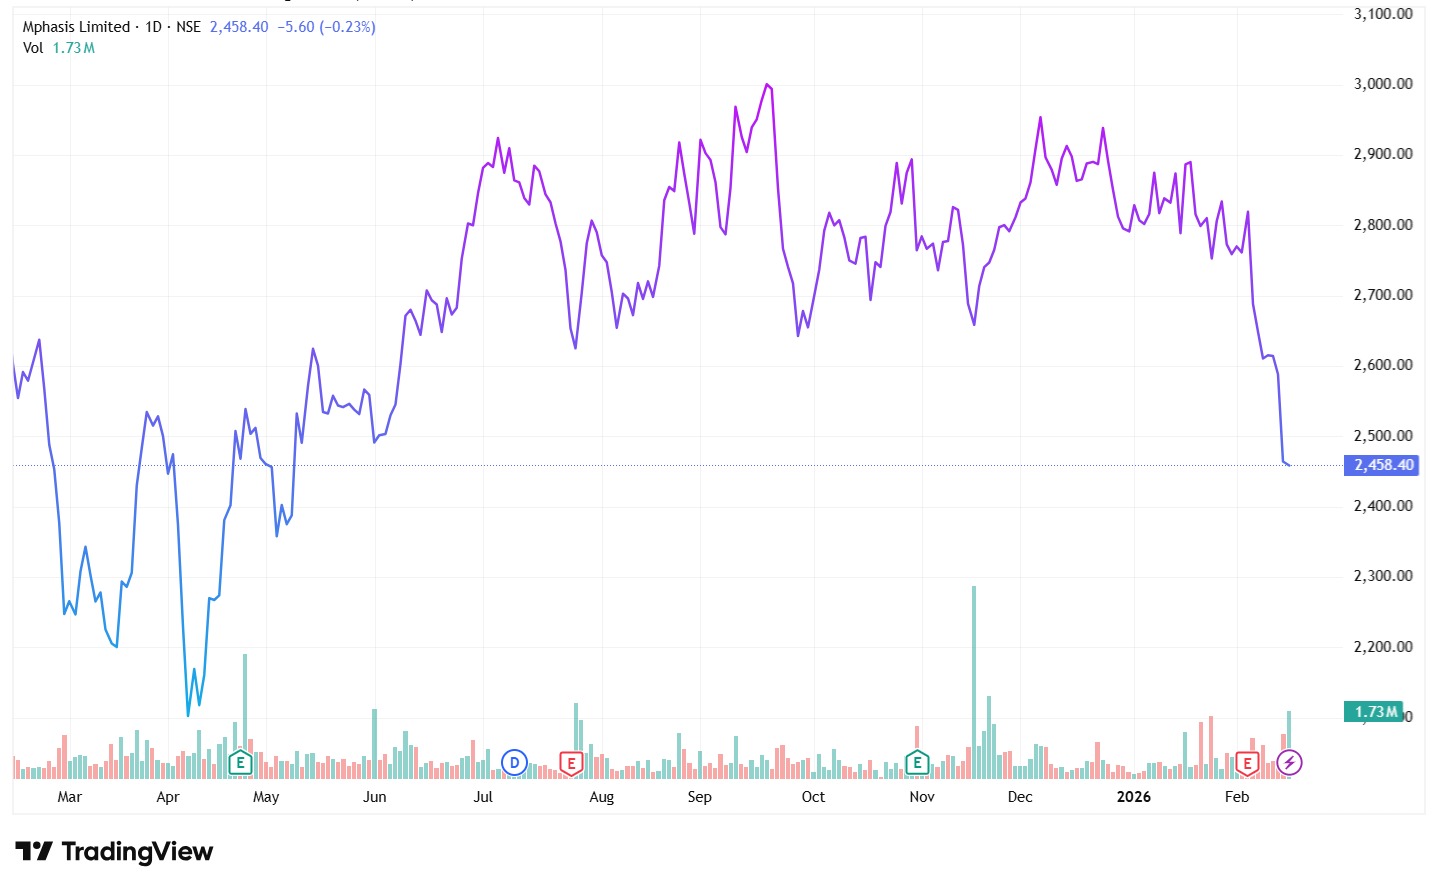
Mphasis Ltd., a leading Information technology solutions provider, saw a significant jump in its DII holding by 8.2% points, taking the total holding to 45.3% at the end of Q3FY26. The FIIs also increased their stake by 1.3% points during the quarter, taking the total holding to 19.8%.
One of the primary reasons for the strong institutional buying is perhaps the introduction of Mphasis NeoIPTM Agentic Platform in Q2FY26. This AI platform is a real game-changer, offering goal-oriented agent orchestration via business and operations agents, engineering, and enterprise agents. Apart from that, it offers product and operations configuration features as well as different data operations features.
During Q3FY26, Mphasis’s total contract value (TCV) win stood at around ₹3850 crore, out of which 69% wins are AI-led.
Coming to financials, the tech giant saw a 12.4% YoY rise in sales during Q3FY26 to ₹4,003 crore from ₹3,561 crore in Q3FY25. The net profit jumped by 9% YoY from ₹428 crore to ₹442 crore during the same period.
While the management has not given any particular numbers or forecast for FY27, they are looking forward to converting what is already there in the pipeline, setting the tone right for the coming fiscal.
1-year Share Price of Mphasis Ltd.
#4 Swiggy Limited
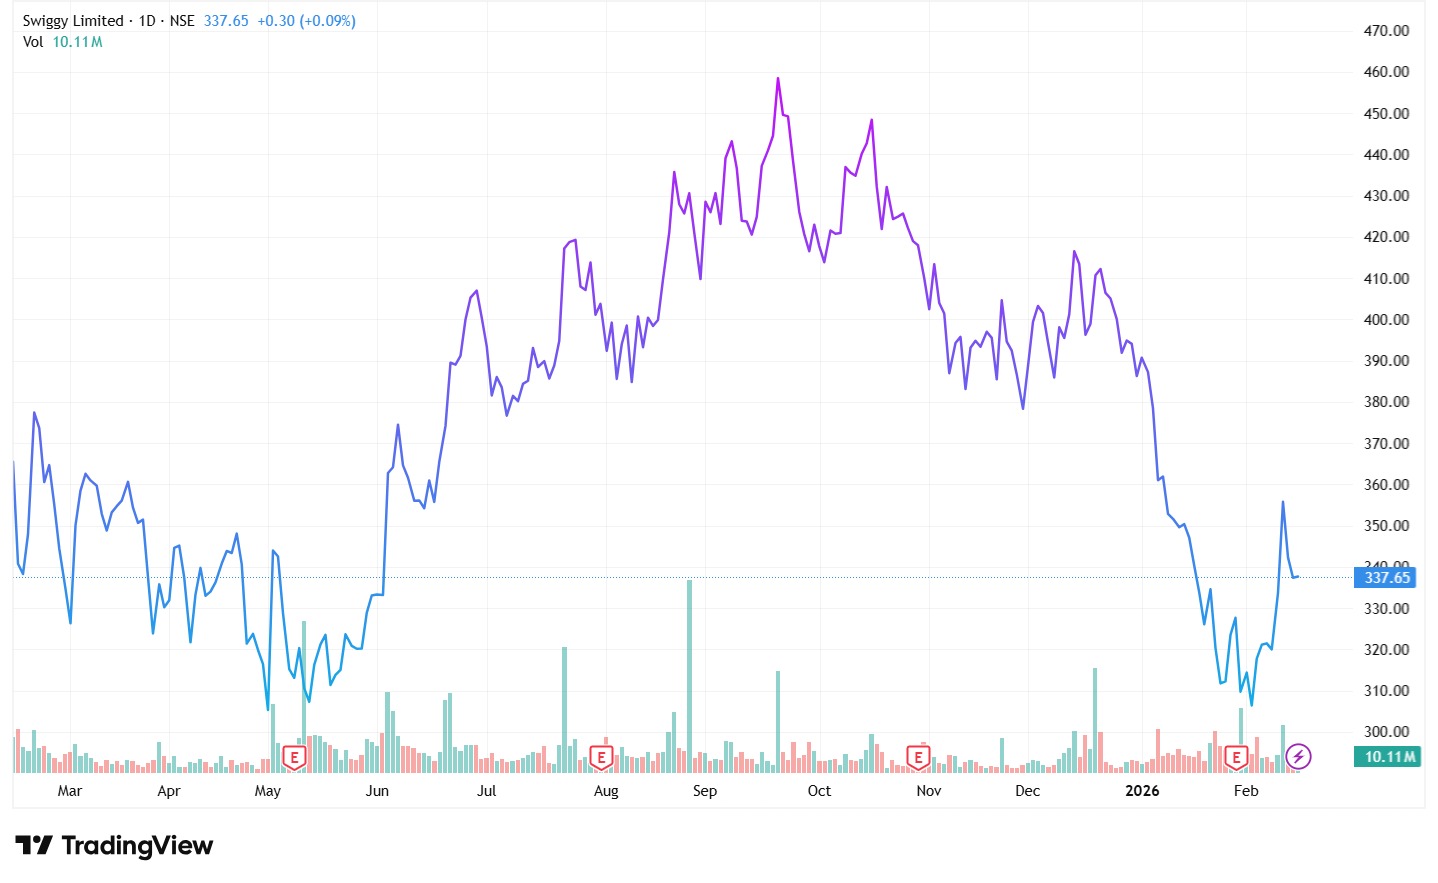
Swiggy Ltd., a relatively new member on the stock exchange, is already seeing all institutional investors flocking around it. Both FIIs and DIIs had a significant stake in the company, but they further raised their stake by 3.8% points and 6.6% points respectively during the quarter. The total holding jumped to 16.1% (FIIs) and 22.5% (DIIs) at the end of Q3FY26.
During the quarter, Swiggy came up with one of the biggest QIPs in India worth ₹10,000 crore.
During the quarter, the platform’s average monthly transacting users (MTU) grew by a whopping 37% YoY to 2.4 crore. Swiggy Platform’s consolidated adjusted revenue grew by a massive 51% YoY to ₹6,431 crore.
The gross order value (GOV) of the food delivery business jumped by 20.5% YoY to ₹8,959 crore during Q3FY26, while the same for the quick-commerce business surged by an astounding 103% YoY to ₹7,938 crore.
The management expects GOV and MTU to grow within a range of 18% to 20% in the upcoming quarters. Also, they are planning to increase their capex in FY27, especially for building more warehousing capabilities to smooth the supply chain.
Coming to financials, sales surged from ₹3,992 crore in Q3FY25 to ₹6,148 crore in Q3FY26, logging a massive 54% YoY growth. However, the company is still incurring losses, and during the quarter, the losses deepened to ₹1,065 crore from ₹799 crore recorded in the corresponding quarter last year.
That said, Swiggy is a new-age tech platform expanding rapidly with massive business growth, and this should convert into profits in coming years. Investors need to keep a close eye, though.
1-Year Share Price Chart of Swiggy Ltd.
#5 RBL Bank Limited
RBL Bank Ltd. also witnessed a rise in its institutional holding as FIIs increased their stake by around 6.4% points, taking the total holding to 21.9%, while DIIs raised their stake by 4.4%, taking the total holding to 39.7% at the end of the quarter.
During the quarter, the bank announced that Emirates NBD will be buying 60% of the stake of the bank by infusing over ₹27,000 crore of capital via a preferential issue. This could be a prime reason behind other institutional investors raising their stake in the bank.
Apart from this, the bank has witnessed 3.9% YoY in its revenue during the quarter, while its profits jumped 555% to ₹214 crore in Q3FY26 from just ₹33 crore in Q3FY25. The profit level is finally back to the pre-COVID level, and this could be another reason for the DIIs and FIIs increasing their stake.
The bank also witnessed an improvement in its asset quality as Gross NPA declined from 2.9% in Q3FY25 to 1.9% in Q3FY26; however, Net NPA increased marginally from 0.53% to 0.55% during the same period.
Advances jumped 14% YoY during the quarter, to ₹1,03,086 crore, while deposits grew by 12% YoY to ₹1,19,729 crore during the period.
The management didn’t offer any particular forecast but highlighted that the massive equity influx should help in raising the bar, and the return ratios should improve over time.
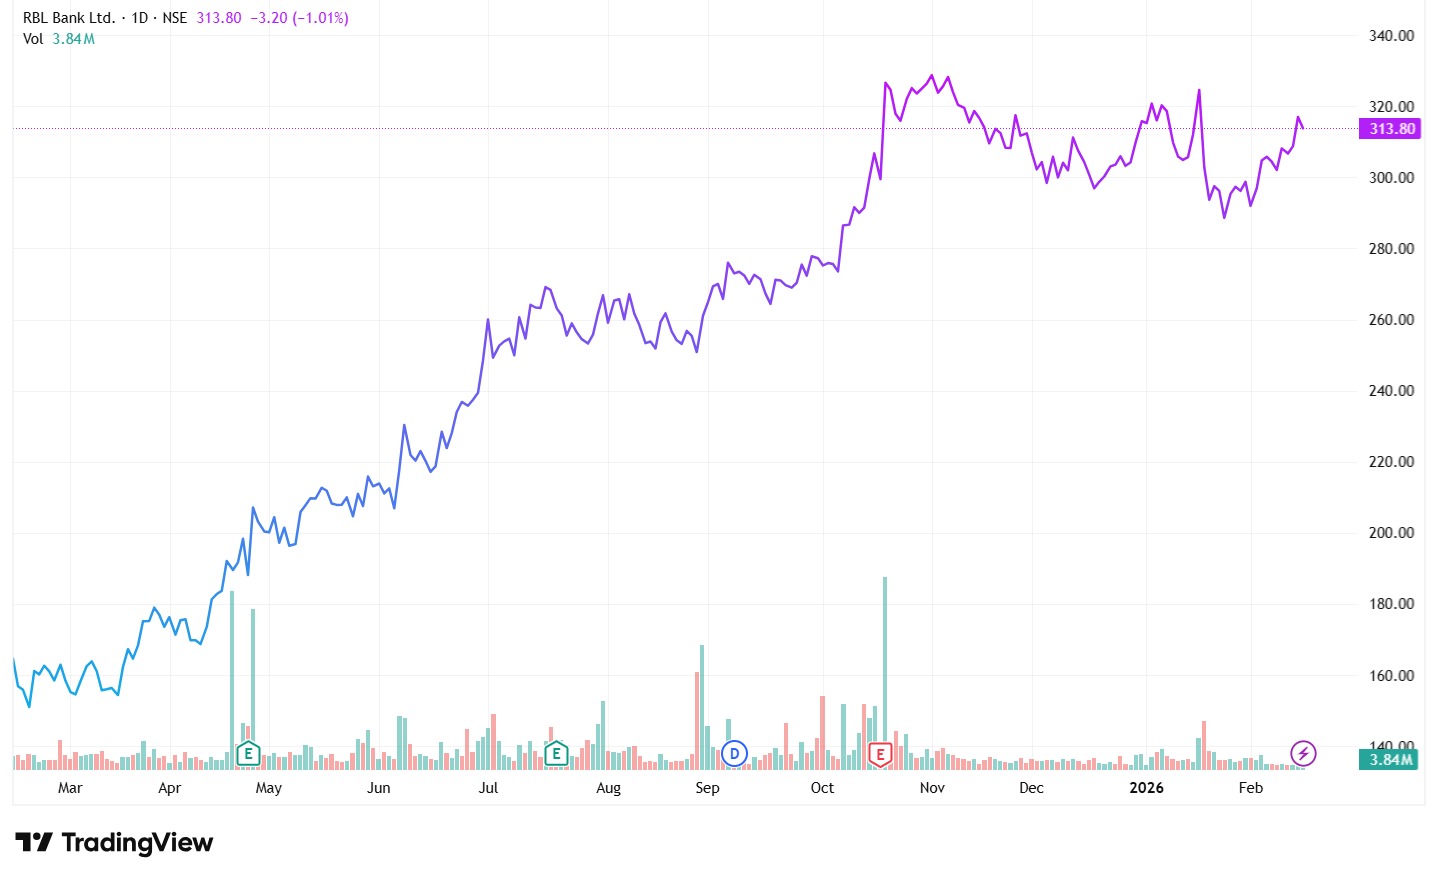
1-Year Share Price Chart of RBL Bank Ltd.
Other Stocks Where FIIs & DIIs Raised Stake
- Synthiko Foils Ltd.: FIIs bought 3.7% stake, and DIIs purchased 6.4% stake, both for the first time in the company’s history.
- Belrise Industries Ltd.: FIIs increased their stake by 1.2% points, taking total holding to 8.9%, and DIIs increased 5.3% points, stake which took the total holding up to 9.3%.
- MTAR Technologies Ltd.: FIIs raised their stake by 3% points, taking total holding to 12.2%, and DIIs increased 5.2% points stake raising total holding to 30%.
- LKP Finance Ltd.: FIIs increased 2.4% points stake taking the total holding to 5%, while DII’s total holding rose to 4%, with an increase of 3.9% points rise in the stake.
Wrapping up
While the overall market remained volatile during the October-December 2025 quarter, institutional investors silently increased their stake in select stocks.
While for some, the strong fundamentals are a main point of attraction, for others, it is the future growth prospects.
Institutional investors even increased their stake significantly in companies which are witnessing returns losses and sluggish returns, which perhaps suggests that they are looking beyond the current financials of the companies.
It may be a good idea to add these stocks to your watchlist and track them to see if the so-called smart investors got their calls right.
Disclaimer:
We have relied on data from www.Screener.in throughout this article. Only in cases where the data was not available have we used an alternate, but widely used and accepted source of information.
The purpose of this article is only to share interesting charts, data points, and thought-provoking opinions. It is NOT a recommendation. If you wish to consider an investment, you are strongly advised to consult your advisor. This article is strictly for educational purposes only.
Maumita Mitra is a seasoned writer specializing in demystifying the world of investment for a broad audience. She has a keen eye for detail and a knack for explaining complex financial concepts in the simplest manner possible.
Disclosure: The writer and her dependents do not hold the stocks discussed in this article.
The website managers, their employees (s), and contributors/writers/authors of articles have or may have an outstanding buy or sell position or holding in the securities, options on securities, or other related investments of issuers and/or companies discussed therein. The content of the articles and the interpretation of data are solely the personal views of the contributors/ writers/authors. Investors must make their own investment decisions based on their specific objectives, resources, and only after consulting such independent advisors as may be necessary.