




Most people don’t choose a hospital because it has the most beds. They choose the one that’s closest when it matters.
If a person needs emergency care, the difference between a hospital that’s 10 minutes away and one that’s 40 minutes away can be critical. That’s why India’s emerging hospital chains are no longer trying to expand into every city. Instead, they’re trying to dominate the cities they’re already in. For investors, that changes how hospital companies should be evaluated.
For years, hospital stocks were primarily evaluated on three familiar metrics: number of beds, occupancy rate, and Average Revenue Per Occupied Bed (ARPOB). Those numbers still matter, but they don’t fully explain which companies are building a durable competitive advantage.
Increasingly, the real moat is network density. A chain operating multiple hospitals within the same city or region can share specialists, create referral networks, negotiate better with insurers, improve procurement costs, and retain doctors more effectively. As hospitals move from being standalone facilities into integrated healthcare networks, scale is no longer just about adding beds; it’s about owning an entire region.
Three Hospital Chains, Three Very Different Playbooks
The interesting part is that there isn’t a single blueprint for building network density. Each company is taking a different route, and their expansion plans offer a useful way to compare them.
#1. Yatharth Hospital: Winning By Building Clusters
Yatharth Hospital isn’t trying to become a pan-India hospital chain overnight. Instead, it is following a cluster-based strategy, building a dominant presence in cities it understands before expanding into adjacent markets. Investors appear to be buying into this strategy as well. The stock has gained nearly 40% over the past 12 months.
Yatharth Hospital: 1yr Stock Price Chart
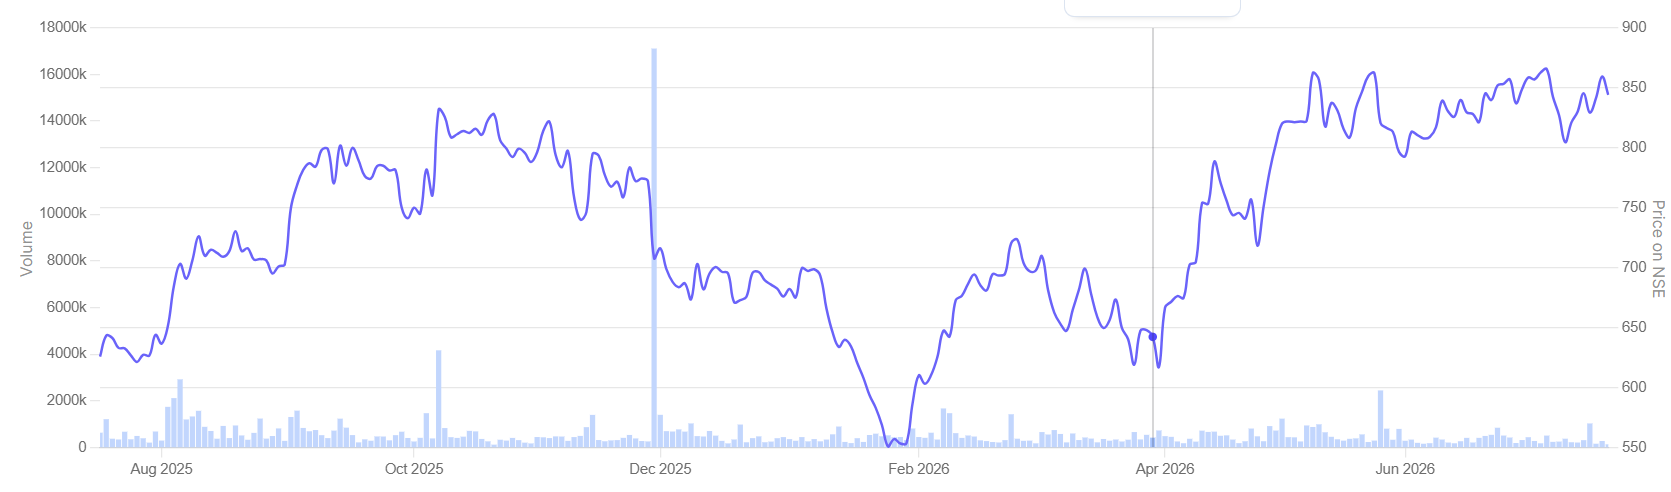
It started with a single hospital in Noida in 2008, and today it operates three hospitals in Noida, two in Faridabad, one in Delhi, one in Gurugram, one in Agra, and one in Jhansi. Management says future acquisitions will also follow this strategy, with nearly 70% of the planned expansion expected to come through acquisitions in familiar markets across North India.
The logic is simple. Multiple hospitals located close to one another allow the company to serve different micro-markets while strengthening its brand, attracting specialists, and creating a referral network across facilities. So, instead of chasing a pan-India footprint, Yatharth wants to become the preferred healthcare provider within each cluster. According to management, this strategy has already worked in Noida and Faridabad, and management intends to replicate it in Gurugram and other cities.
Strategy Proven by Financials
Yatharth Hospitals: Financial Performance
| Metrics | FY25 | FY26 | Change |
| Sales (₹ crore) | 886 | 1,207 | 36.0% |
| EBITDA Margin (%) | 25.4 | 24.2 | -125 bps |
| Net Profit (₹ crore) | 131 | 170 | 30% |
| Return on Capital Employed (%) | 19.0 | 16.0 | – 300 bps |
The numbers suggest the strategy is gaining traction. Revenue grew 36% YoY to ₹1,207 crore in FY26, while EBITDA margin declined by 125 bps. EBITDA margin declined mainly because employee and other operating expenses increased by 44% and 39%, respectively.
Return on Capital Employed (ROCE) declined by 300 bps to 16% in FY26 largely on account of fundraise and capex for infrastructure upgrades.
Yatharth Hospitals: Improving Operational Efficiency
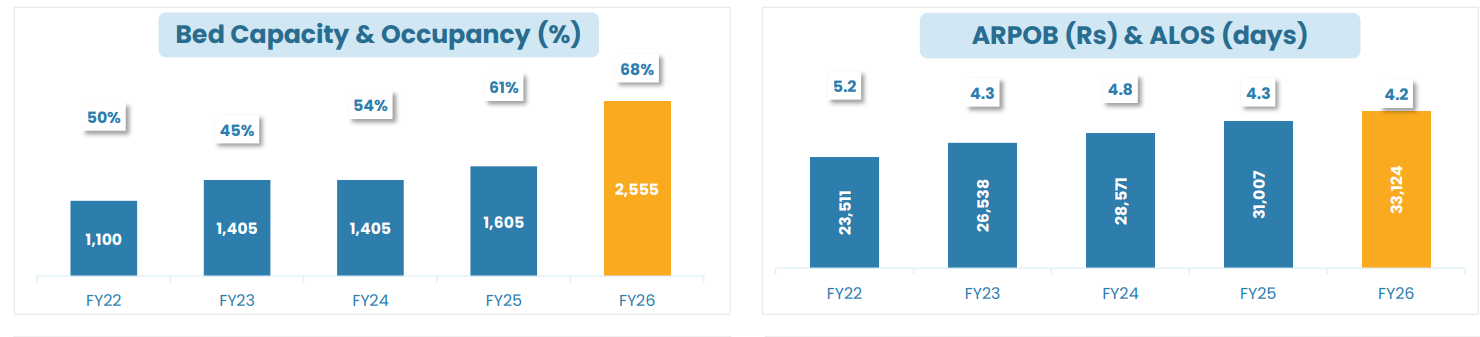
The network occupancy improved to 68% for the year with an increase of 7% in average revenue per occupied bed (ARPOB) to ₹33,124. Average Length of Stay (ALOS) also decreased by 1 day compared to FY22, from 5.2 days to 4.2 days.
A falling ALOS is generally a good sign. Hospital revenue is largely generated in the early stages of treatment, when diagnostics, surgeries and intensive care are provided. Shorter recovery times mean shorter bed times, allowing hospitals to treat more patients without increasing capacity.
Yatharth plans to double its bed capacity to over 5,000 in the next three years. The company expects it could achieve the target sooner. Investors should watch more than just bed additions. The bigger question is whether the company’s strategy continues to lift occupancy, ARPOB and operating leverage as new hospitals mature.
#2. Park Medi World: Scaling Without Overspending
Park Medi World is also following Yatharth’s strategy, but at a different scale and economics. The company is expanding rapidly while keeping the capital costs low and building clusters across its key markets.
Today, Park Medi World is the second-largest private hospital chain in North India and the largest in Haryana. It operates 16 NABH-accredited multi-specialty hospitals, 10 of which were acquired. Instead of expanding across the country, the company is concentrating on creating a dense regional network while keeping capital expenditure among the lowest in the industry.
The Real Moat: Capital Efficiency
Park’s biggest competitive advantage lies in how efficiently it adds capacity. Its recently commissioned 350-bed Panchkula hospital was built at a capital cost of around ₹35 lakh per bed, significantly lower than most listed peers.
But low capital costs are only one part of the strategy. Park prefers to deepen its presence in existing markets rather than expand into new ones.
Its flagship Palam Vihar hospital in Gurugram had an occupancy rate of close to 86% in FY26, generating revenue of almost ₹245 crore. Instead of entering another city, the company is adding capacity nearby through Park Hospital Platinum, allowing both hospitals to share specialist doctors, high-end medical equipment and administrative resources.
Park uses this cluster-based model throughout its network, usually adding hospitals within 40-50 kilometers of its existing facilities. It is replicating the strategy in Uttar Pradesh, where it plans to build a regional network around Agra, Kanpur and Gorakhpur.
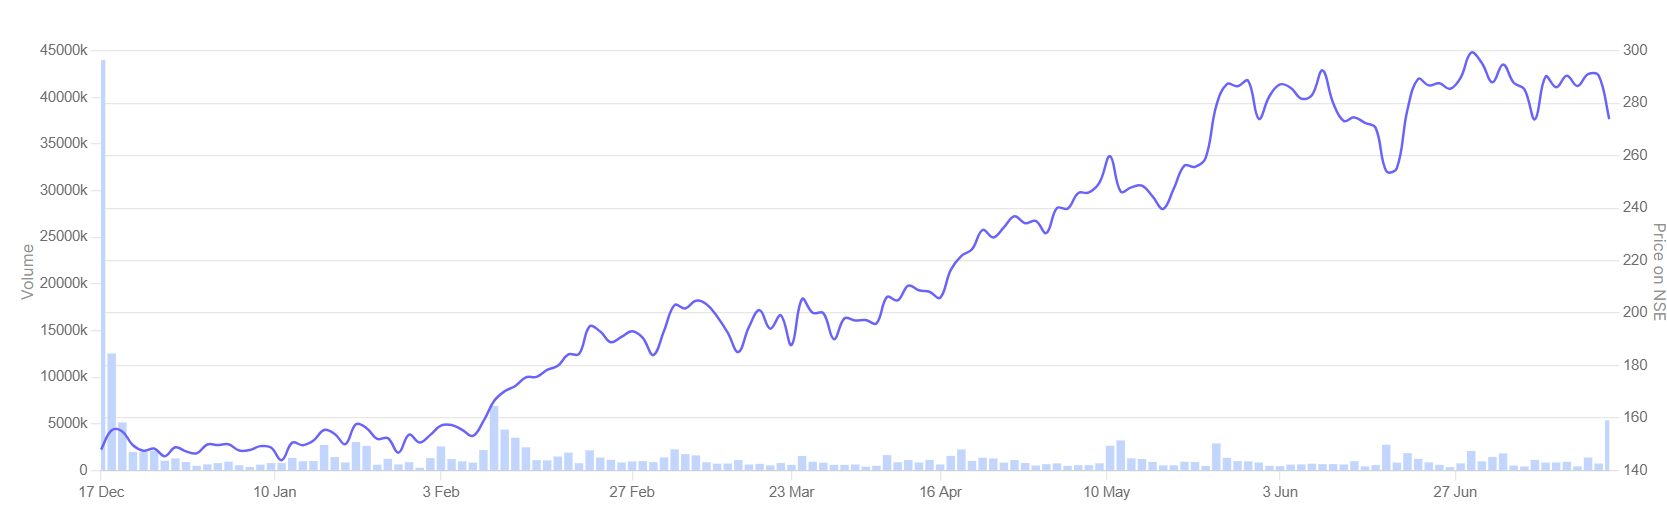
This disciplined expansion strategy is also resonating with investors. The stock has gained nearly 86% over the past year, rising from around ₹148 to a high of ₹305.
Park Medi World: 1yr Stock Price Chart
Growth Backed by Improving Asset Utilisation
Park Medi World: Financial Performance
| Metrics | FY25 | FY26 | Change |
| Sales (₹ crore) | 1,394 | 1,679 | 20.4% |
| EBITDA Margin (%) | 26.6 | 26.5 | -16 bps |
| Net Profit (₹ crore) | 215 | 274 | 27% |
| Return on Capital Employed (%) | 20 | 18 | – 200 bps |
The strategy is already translating into steady financial performance. Park Medi World reported consolidated revenue of ₹1,679 crore in FY26, up 21% YoY. Net profit was up 27% to ₹274 crore. Despite commissioning new hospitals, EBITDA margin remained stable at 26.5%, reflecting disciplined execution.
The company’s Q4 ARPOB increased to ₹29,725. But management has said repeatedly that ARPOB is only one performance indicator. The focus remains on generating higher returns through efficient capital allocation instead of premium pricing.
#3. Aster DM Healthcare: Buying Scale, Then Building Synergies
Like Yatharth and Park Medi World, Aster DM is also doubling down on inorganic growth.
Instead of expanding hospital by hospital, the company has transformed itself through the merger with CARE Hospitals, KIMSHEALTH, and Evercare. The combined entity now has 39 hospitals across Karnataka, Kerala, Telangana, Andhra Pradesh, Maharashtra, Odisha, and Madhya Pradesh, making it one of India’s largest private hospital platforms.
The objective isn’t simply to become larger. It is to create multiple regional networks that can share doctors, improve referrals, and deliver higher-value treatments across the network. The combined entity is now aiming to cross 15,000 beds, with a specific focus on pushing advanced medical services into tier-2 and tier-3 cities.
Aster DM: Combined Proforma Numbers
| Metrics | FY26 | YoY Growth |
| Sales (₹ crore) | 9,273.0 | 14% |
| EBITDA Margin (%) | 21.7 | 116 bps |
| Return on Capital Employed (%) | 21.1 | 293 bps |
Aster DM’s merger with Care Hospital was completed in July 2026. The above table shows the financial profile of the combined entity. On a standalone basis, Aster was already firing before the merger closed. Q4 FY26 revenue grew 18% YoY to ₹1,182 crore, operating EBITDA (excluding the newly commissioned Kasaragod facility) grew 31% to ₹253 crore, and net profit jumped 45% YoY to ₹153 crore.
Usually, a merger of this size can destroy capital efficiency if integration goes wrong. But the combined ROCE figure improved by 293 bps, indicating Aster is capable of operating a much larger network without diluting returns.
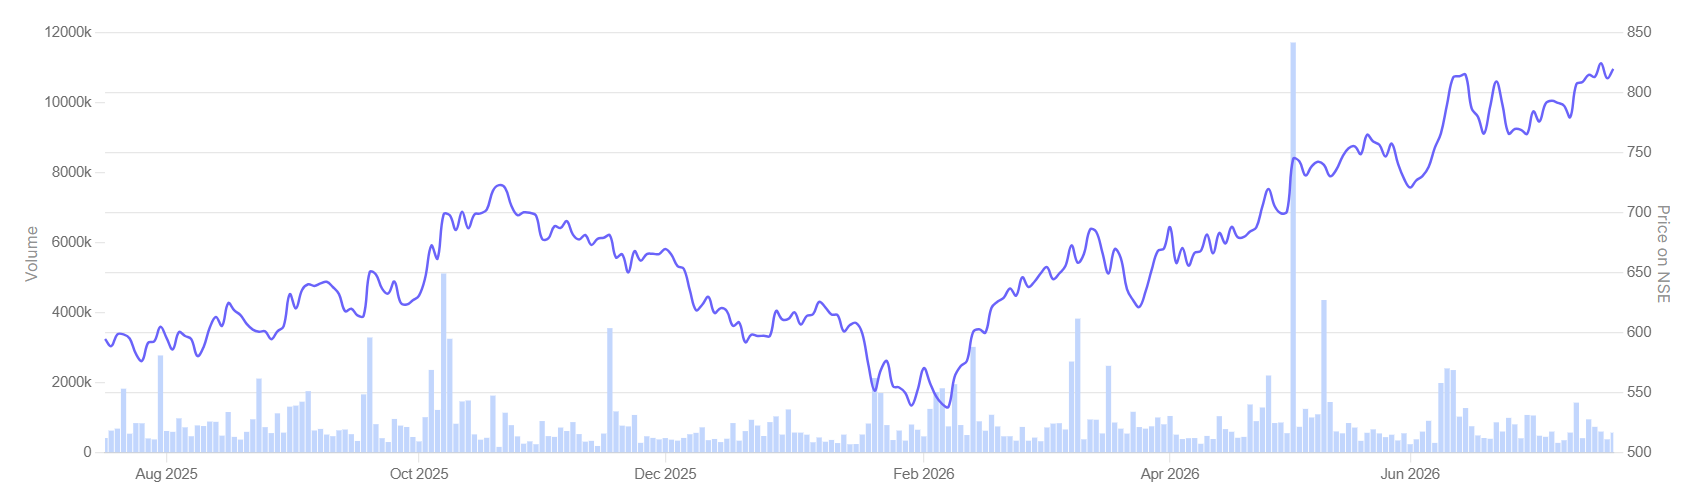
Aster DM Healthcare’s acquisition-led expansion has been accompanied by a sharp re-rating in the stock. Over the past year, it has risen from around ₹590 to above ₹800 as investors increasingly factor in the potential benefits of scale and synergies.
Aster DM Healthcare: 1 yr Stock Price
Using Scale to Improve Quality, Not Just Capacity
Management believes the biggest opportunity lies in improving the quality of business within its existing hospitals rather than merely adding new beds.
Across mature hospitals, revenue continues to grow in the mid-teens while EBITDA margins have crossed 30%, driven by a higher share of complex procedures and a richer specialty mix. Oncology remains a key focus area, with management expecting significant growth over the next two years as investments in cancer care begin contributing across the network.
Aster’s near-term expansion is largely focused on brownfield projects. Of the nearly 1,700 beds planned over the next few years, around 1,500 beds will come through brownfield expansions within existing hospitals, which will limit execution risk.
For investors, Aster represents a different way to scale a hospital business. The focus is on building regional dominance city by city and bringing regional leaders into a single national platform, thereby creating a network effect.
Three Companies, Three Different Paths to Scale
| Company | Network-building Strategy | Competitive Advantage | Expansion Model | What Investors Should Track |
| Yatharth Hospital | Build dense regional clusters | Strong referral network and catchment dominance | Organic expansion plus selective acquisitions within North India | Occupancy improvement, ARPOB growth and operating leverage as new hospitals mature |
| Park Medi World | Expand regional clusters with capital discipline | Low capex per bed and faster integration of acquired hospitals | Acquisition-led expansion within 40-50 km clusters | Return on capital, capex efficiency and profitability of acquired hospitals |
| Aster DM Healthcare | Increase network density through acquisitions | Multi-cluster network, procurement synergies and clinical integration | M&A-led consolidation supported by brownfield expansion | Merger synergies, margin expansion, cross-referrals and specialty mix |
Valuation: What Is the Market Pricing In?
Valuation: P/E Multiple Trends
| Company | P/E | 5-yr Median PE | EV/EBITDA | 5-yr Median EV Multiple |
| Yatharth Hospital | 46.4 | 38.1 | 25.6 | 22.4 |
| Park Medi World | 45.8 | 47.3 | 25.1 | 22.0 |
| Aster DM Healthcare | 175.2 | 79.5 | 73.1 | 28.5 |
| Apollo Hospitals | 64.9 | 81.3 | 33.5 | 34.3 |
| Max Healthcare | 71.5 | 72.0 | 45.2 | 43.2 |
| Fortis Healthcare | 67.9 | 62.0 | 34.8 | 26.9 |
Hospital stocks are generally valued on EV/EBITDA (Enterprise Value / Earnings Before Interest, Tax, Depreciation, and Amortisation), as the metric is less affected by differences in capital structure, depreciation, and acquisition-related accounting than P/E.
Among the three companies, Park Medi World appears to offer the most balanced valuation. It is trading at 25.1x EV/EBITDA, just above its five-year median of 22x, despite delivering steady earnings growth and maintaining healthy margins. The market appears to be waiting for stronger evidence that its strategy of capital-efficient growth can sustain superior returns.
Yatharth Hospital is trading at 25.6x EV/EBITDA, compared with its historical median of 22.4x. The premium suggests investors are already pricing in faster earnings growth as newer hospitals mature and its North India cluster begins to deliver operating leverage.
Aster DM Healthcare stands apart. At 73.1x EV/EBITDA, the stock trades well above its historical average of 28.5x. However, the comparison isn’t entirely meaningful. The recent merger with Quality Care India has temporarily distorted both earnings and enterprise value.
Compared with established peers such as Apollo Hospitals, Max Healthcare and Fortis Healthcare, both Yatharth and Park continue to trade at lower EV/EBITDA multiples, suggesting the market still views them as emerging regional players rather than mature hospital platforms.
What Should Investors Watch Next?
India’s hospital sector still has a long runway for growth. But as more organised players expand, simply adding beds will no longer be enough to create shareholder value. The next phase will be defined by execution.
Investors should closely monitor three factors. First, occupancy, as newer hospitals mature and operating leverage kicks in. Second, case mix and ARPOB, where higher-value specialties such as oncology and cardiac care can drive sustainable profitability. Third, capital allocation. While Yatharth is building regional clusters, Park Medi World is focused on capital-efficient expansion, and Aster DM is betting on consolidation. Over time, the market is likely to reward the model that consistently generates superior returns on capital.
However, analysing these emerging players in isolation tells only half the story. They are competing against established hospital chains such as Apollo Hospitals, Max Healthcare and Fortis Healthcare, which continue to expand capacity, strengthen specialty offerings and pursue acquisitions of their own.
The next step, therefore, is to compare how these challengers stack up against the incumbents, and whether their distinct growth strategies are strong enough to gain market share in an increasingly competitive industry.
Add these stocks to your watchlist and track how well they execute their growth strategies.
Disclaimer:
Note: We have relied on data from www.Screener.in throughout this article. Only in cases where the data was not available, have we used an alternate, but widely used and accepted source of information.
The purpose of this article is only to share interesting charts, data points and thought-provoking opinions. It is NOT a recommendation. If you wish to consider an investment, you are strongly advised to consult your advisor. This article is strictly for educative purposes only.
Deepan Datta has spent over a decade studying stocks and mutual funds. His passion is to uncover interesting stories in the financial markets and share them through his writings with investors at large. He is focused on delivering clear, easy to understand and research-backed insights. Deepan began his career as a Research Associate at S&P Global, where he developed a strong foundation in financial research and data analysis.
Disclosure: The writer and his dependents do not hold the stocks discussed in this article.
The website managers, their employees (s), and contributors/writers/authors of articles have or may have an outstanding buy or sell position or holding in the securities, options on securities or other related investments of issuers and/or companies discussed therein. The content of the articles and the interpretation of data are solely the personal views of the contributors/ writers/authors. Investors must make their own investment decisions based on their specific objectives, resources and only after consulting such independent advisors as may be necessary.