



As the International Cricket Council (ICC) debated having a two-tier World Test Championship, there was stern opposition from the Pakistan Cricket Board and the England and Wales Cricket Board. They were not in favour of a two-tier system, but wanted all 12 permanent Test-playing nations to remain part of the WTC.
The logic behind that argument comes from the disparity between the earnings of the Big Three — the BCCI of India, the ECB of England, and Cricket Australia — and the remaining nine Test-playing nations. By making it a six-team, two-tier system, the chances of teams outside the Big Three hosting marquee opponents would shrink dramatically, dwindling their finances even further.
The Big Three refers to an unofficial alliance of the English, Australian, and Indian cricket boards, who collectively take more than 50 per cent of ICC revenues under the current distribution agreement. They also operate the wealthiest domestic leagues and the most robust cricketing infrastructure on the planet, built and refined over more than a century.
But what about the remaining nine Test-playing members? The reasoning for excluding Ireland, Afghanistan, and Zimbabwe from the WTC — and for scheduling two-match Test series against the remaining six rather than the five-match series the Big Three play among themselves — is that these boards cannot bear the cost of those matches. So what exactly do these boards earn? That is the million-dollar question.
We at Financial Express digital dug into the available annual reports of all nine non-Big Three Test-playing nations to find out how much they earn, how they earn it, and whether those earnings are sufficient to host a three-match Test series without financial distress.
One important caveat before the numbers: these boards do not report on synchronised calendars. Pakistan’s audited accounts close in June 2023. Sri Lanka and Zimbabwe report to December 2024. Ireland closes December 2025. New Zealand’s year ends July 2025. Cricket South Africa closes in April 2025. The figures below are drawn directly from each board’s most recently published official document and must be read with that temporal unevenness in mind. A year with a World Cup on home soil looks very different from one without it.
Note on rankings: The leaderboard below is ordered by overall financial strength — a composite of annual revenue, net surplus, and accumulated reserves — rather than by revenue alone. On pure revenue, South Africa leads this group. But on the combined measure of what a board earns, what it keeps, and what it has built up over time, Pakistan stands alone at the top of the non-Big Three world.
1. Pakistan Cricket Board: The Undisputed King of the Chasing Pack
For the year ended June 30, 2023, the PCB recorded total income of PKR 16,424,122,531 — 16.42 billion Pakistani rupees, or approximately $58.9 million USD. Against total expenditure of PKR 12,450,222,610, the board posted a surplus before taxation of PKR 3,973,899,921. After a tax charge of PKR 885,397,398 — one of the few instances of a cricket board paying meaningful taxation on its operations — the surplus after tax was PKR 3,088,502,523, approximately $11.1 million USD.
The General Fund balance, reflecting accumulated surpluses since inception, stood at PKR 20,393,054,686 as at June 30, 2023 — a war chest that no other board in this group comes close to matching.
The revenue architecture deserves close examination because it is unlike any other board in this group.
The Home Tour Premium: Tours inside Pakistan and at neutral venues generated PKR 3,690,003,875 — the single largest bilateral revenue line. The return of consistent international cricket to Lahore, Karachi, and Rawalpindi after years of hosting exile has turned home series back into genuinely profitable commercial events. Corporate hospitality, local sponsorship activations, and stadium branding packages that previously leaked overseas now stay inside Pakistan’s economy.
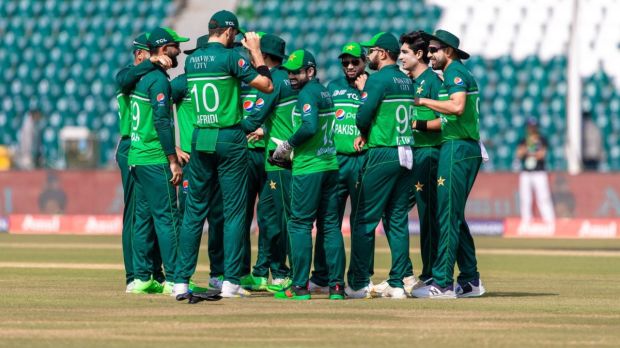
The PSL Engine: The Pakistan Super League contributed PKR 3,555,223,483 — the board’s second largest single revenue stream and its most strategically important. Unlike the IPL, which operates largely as a private franchise ecosystem at arm’s length from the BCCI’s central accounts, the PSL’s commercial architecture routes licensing fees, title rights, and central broadcasting packages directly through the PCB’s own ledger. The league is not a separate profit centre — it is the PCB’s commercial heartbeat.
The ICC and International Tournament Pool: International tournaments generated PKR 5,432,519,675 — the largest single category in the income statement, reflecting ICC distributions, bilateral hosting fees, and participation revenues from global events. This is the guaranteed structural baseline that underwrites everything else.
The Treasury Income: Here is the figure that separates the PCB from almost every other sports organisation at this level: return on investments and bank deposits contributed PKR 2,640,790,641 — 16.1% of total income. The board’s PKR 16.2 billion short-term investment portfolio is not merely a safety cushion. It is an active income generator, producing returns equivalent to what many boards earn from their entire domestic cricket operations. When a cricket board’s savings account earns more in a year than Afghanistan earns in total, it is a signal of truly extraordinary accumulated capital.
2. South Africa: The Most Profitable Operation
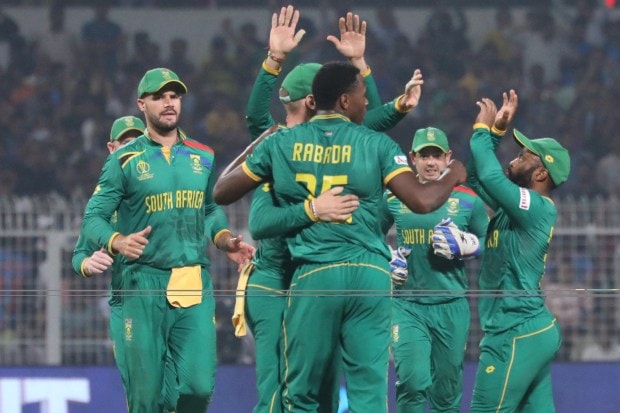
Cricket South Africa’s summary consolidated financial statements for the year ended April 30, 2025, present the cleanest profitability story of any board in this group.
Total group revenue reached R1,391,360,000 — approximately $74.7 million USD at reporting-period rates — making CSA the highest-revenue board in this analysis on a straightforward income statement basis. Professional cricket delivered R1,361,056,000 of that total; amateur cricket contributed R30,304,000.
Against total expenses of R1,298,674,000, and after investment income of R95,227,000, net foreign exchange gains of R29,226,000, and a R49,594,000 share of profit from joint ventures, profit before taxation was R237,978,000 — approximately $12.8 million USD. Total comprehensive profit for the year matched that figure exactly.
CSA’s profitability is structurally anchored to the India bilateral premium. When India tours South Africa for a multi-format home summer, the broadcast rights premiums, sponsor activations, and hospitality packages attached to those fixtures shift CSA’s revenue curve materially upward. The 2024/25 accounts reflect a year in which those returns were captured at significant scale.
3. Sri Lanka: The ICC’s Most Revenue-Dependent Board
Sri Lanka Cricket’s income statement for the year ended December 31, 2024, is the most granular financial document of any board in this group.
Total revenue from contracts reached LKR 17,232,615,851. Adding membership subscriptions and other income, total income was LKR 17,982,246,901 — approximately $54.0 million USD. The dominant line is stark: ICC Annual Distributions contributed LKR 10,164,353,566, representing 59% of all contract revenue. International cricket hosting generated a further LKR 5,146,934,436. Domestic cricket contributed LKR 1,155,760,915 and marketing LKR 765,566,934.
Total operational expenditure was LKR 16,350,849,937, leaving an operational surplus before finance costs and depreciation of LKR 1,631,396,965. After depreciation, a foreign exchange loss of LKR 832,453,201 — a recurring structural risk for a board earning predominantly in USD while reporting in a weaker local currency — and a tax reversal, the surplus after income tax was LKR 42,699,843. Total comprehensive income for the year was LKR 140,338,948, approximately $0.4 million USD.
SLC’s revenue scale places it firmly in the upper tier of non-Big Three cricket. But the 59% ICC dependency is a structural vulnerability: any renegotiation of the ICC distribution model hits Colombo harder than almost anywhere else outside Lord’s, Melbourne, or Mumbai.
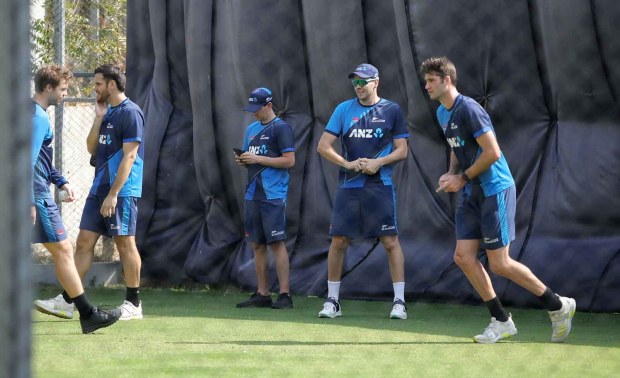
4. New Zealand: World-Class Cricket, Structurally Exposed Finances
New Zealand Cricket’s summary statement for the year ended July 31, 2025, is the most honest illustration of the vulnerability facing high-performing but small-market cricket nations.
Operating revenue was NZD 81,393,000, down from NZD 97,245,000 the prior year — a 16.3% single-season decline. Total revenue including other income was NZD 83,146,000, equivalent to approximately $50.8 million USD. The board recorded a deficit for the year.
The year-on-year swing of NZD 15.3 million is itself the story. NZC’s income is acutely sensitive to the bilateral touring calendar. A home series against India or England generates dramatically different broadcast and gate receipts from a quieter summer. When the marquee fixtures are absent, the revenue line falls — and there is no PSL or BPL-scale domestic league routing revenues through NZC’s own accounts to compensate.
NZC is not in crisis. Its operational structure is lean and professional. But the accounts illustrate precisely why mid-tier boards have pushed the ICC for more equitable bilateral scheduling: a NZD 15 million single-year revenue swing is existentially significant for a board of this scale.
5. West Indies: The Deficit That Explains a Structural Crisis
Cricket West Indies’ financial performance highlights for 2025 are the starkest numbers in this entire analysis — and the board presents them with admirable candour.
Revenue for the financial year was $40,886,359 USD, down from $88,354,688 in 2024 — a 54% year-on-year collapse. The explanation is structural, not operational: CWI operates within a four-year ICC commercial cycle. Years in which major global events are hosted generate materially elevated revenues through hosting rights, participation fees, and commercial partnerships. 2024 was such a year. 2025 was not.
Tour and tournament expenses reached $41,590,789 — exceeding total revenue. Operating expenses added $27,818,693. Net loss for the year: $28,531,921, against a $22,638,203 profit in 2024 — a $51 million swing in a single year.
This is not mismanagement. It is the mathematical consequence of governing cricket across seven sovereign nations and dozens of islands, with no single dominant domestic franchise league to smooth the ICC cycle’s peaks and troughs. Multi-island travel logistics, multi-venue stadium liabilities, and the structural absence of a commercially centralised T20 property in the PSL or BPL mould leave CWI permanently exposed to the four-year rhythm of global cricket’s commercial calendar.

6. Bangladesh: The Fortress of Fiscal Conservatism
The Bangladesh Cricket Board’s Statement of Revenue Budget for FY 2023-24 — a budget document rather than audited accounts, an important distinction — reveals the architectural choices of a board that has prioritised financial safety over commercial expansion.
Total budgeted revenue was BDT 4,468,095,329, approximately $36.3 million USD. The ICC full member distribution dominates at BDT 2,376,000,000 — 53% of projected income. The BPL T20 contributes BDT 564,800,000. Asian Cricket Council hosting rights generated BDT 432,000,000. International TV rights added BDT 174,561,532.
The most structurally distinctive figure: interest on fixed deposit receipts of BDT 553,552,032 — over half a billion taka generated purely by parking surplus capital in guaranteed-return bank instruments. When a board’s passive savings income exceeds what most of its peers earn from title sponsorships, it signals remarkable accumulated fiscal conservatism. The BCB does not need to chase risky commercial ventures because its treasury does the work quietly, year after year.
7. Zimbabwe: The Recovery Story
Zimbabwe Cricket’s consolidated Statement of Financial Position as at December 31, 2024, tells one of the more remarkable financial recoveries in sport governance of the past decade.
Total group assets stand at $24,817,835 USD — roughly double the $10,865,281 recorded in 2023. Accumulated surplus is $11,846,896. Total liabilities are contained $2,629,761. The board that was once drowning in $19 million of toxic historical debt now operates with a clean, solvent balance sheet.
An income statement was not available in the documents published. But the asset trajectory — a near-doubling in a single year — reflects the outcomes of the ICC’s financial assistance framework and infrastructure investment. Zimbabwe’s financial story is not yet one of commercial prosperity. It is one of institutional survival, stabilisation, and the slow, disciplined reconstruction of a cricket economy from the ground up.
8. Ireland: Surviving on 70 Cents in Every Euro
Cricket Ireland’s Statement of Income and Retained Earnings for the year ended December 31, 2025, is the document of a board that has made full Test status work on an extraordinarily lean budget.
Total income was €17,454,314, approximately $18.9 million USD. The ICC distribution contributed €12,321,141 — 70.6% of all income. Grants from Sport Ireland and Sports Northern Ireland added €2,135,922. Sponsorship and match income reached €1,726,741, up sharply from €978,816 the prior year. Broadcasting income was €928,545.
After direct expenses of €11,309,567 and administrative expenses of €6,107,887, net surplus before taxation was €36,860. After interest charges of €110,108, the board recorded a net deficit of €73,248.
Retained earnings stand at a deficit of €3,526,337 — the accumulated consequence of years in which operational costs have outpaced income. The improvement in sponsorship income in 2025 is an encouraging signal. But 70 cents of every euro earned coming from a single source in Dubai is a fragility that Irish cricket will need to address as it builds toward genuine commercial independence.
9. Afghanistan: Extraordinary Achievement, Minimal Resources
Afghanistan Cricket Board’s revenue data from FY 2022 is the oldest in this dataset — a caveat that matters significantly given the ACB’s rapidly evolving operational environment.
Total revenue was $9.92 million USD. ICC distributions accounted for 48% at $4.75 million. Asian Cricket Council regional distributions contributed 31% at $3.07 million. Government funding provided 10% at $1 million. Sponsorships, media and marketing generated 11% at $1.05 million.
The expenses breakdown shows a board spending 53% of its budget on international cricket operations — an extraordinarily high proportion reflecting the costs of fielding a national team without a permanent home ground or established domestic hosting infrastructure.
The ACB’s story is ultimately one of extraordinary achievement on minimal resources. A board earning under $10 million per year has produced a Test nation capable of defeating any opponent in the world on a given day. The financial sustainability of that achievement, particularly given the board’s current operational restrictions, remains the central unresolved question in associate cricket.
Cricket Board Financial Reports Summary
| # | Board | Reporting Period | Revenue (USD) | Net Income (USD) | Primary Income Source |
| 1 | Pakistan (PCB) | Year ended Jun 30, 2023 | $58.9M | +$11.1M | ICC/tournaments + PSL + home tours + treasury returns |
| 2 | South Africa (CSA) | Year ended Apr 30, 2025 | $74.7M | +$12.8M | Professional cricket + India bilateral series |
| 3 | Sri Lanka (SLC) | Year ended Dec 31, 2024 | $54.0M | +$0.4M | ICC distributions (59% of revenue) + international hosting |
| 4 | New Zealand (NZC) | Year ended Jul 31, 2025 | $50.8M | Deficit | Broadcast exports + bilateral tours |
| 5 | West Indies (CWI) | FY 2025 | $40.9M | -$28.5M | ICC event cycle hosting + regional sponsors |
| 6 | Bangladesh (BCB) * | FY 2023-24 (budget) | $36.3M | +$1.7M | ICC distributions + BPL T20 + FDR interest |
| 7 | Zimbabwe (ZC) ** | Year ended Dec 31, 2024 | $24.8M | — | ICC assistance + infrastructure grants |
| 8 | Ireland (CI) | Year ended Dec 31, 2025 | $18.9M | -$0.08M | ICC distributions (70% of income) + grants |
| 9 | Afghanistan (ACB) *** | FY 2022 | $9.92M | +$0.34M | ICC + ACC distributions + government funding |
The Two Structural Archetypes
Reading these nine ledgers together, two distinct financial archetypes emerge.
The first is the capital accumulator. Pakistan’s treasury income of PKR 2.64 billion — earned purely from investments — is the defining exhibit. Bangladesh’s fixed deposit interest machine, Sri Lanka’s accumulated fund, and the PCB’s PKR 20.4 billion general fund balance all reflect the same philosophy: convert ICC distributions and tournament revenues into thick reserve cushions, then let the cushions earn. These boards can survive a quiet touring cycle without approaching a government or a bank.
The second is the cycle-dependent operator. West Indies earned $88 million one year and $41 million the next. New Zealand dropped 16% in a single summer. Ireland runs a structural deficit. These boards are not mismanaged — they are structurally exposed to a commercial calendar they do not control. When the ICC event or the India tour comes to town, the books balance. When it doesn’t, they don’t.
The financial divide in non-Big Three cricket is not primarily about cricketing quality or market size. It is about whether a board has had the institutional discipline or the geopolitical fortune to build reserves deep enough to insulate itself from the four-year rhythm of the ICC’s commercial calendar. The ones that have built those reserves run cricket. The ones that haven’t run on hope.
And at the top of the chasing pack, Pakistan’s treasury earns more in a year than Afghanistan earns in total. That is the true measure of the financial gulf inside non-Big Three cricket.
All financial data sourced directly from each board’s most recently published official financial statements. Exchange rates applied at reporting-period historical averages. BCB figures are from an approved budget document and should not be treated as audited actuals. Zimbabwe figures reflect balance sheet position only. Rankings reflect overall financial strength across revenue, surplus, and accumulated reserves.