")

By Omkar Goswami
To understand the disparities between the states of India and the country’s, we examined female infanticide, infant- and under-5 mortality, and literacy in the first of this two part series (bit.ly/3B8YTpl). We will now take up two more themes, and on the basis of all five, draw the spatial contours of development in India.
Marital and fertility
Here, I looked at three indicators from NHFS-5, namely:
a) The total fertility rate (children per woman): The all-India average has reduced to 2 in 2019-21, versus 2.2 in 2014-15. However, Uttar Pradesh, Bihar, Jharkhand, Manipur and Meghalaya are higher.
b) Women between 20 and 24 years who were married before they were 18: The all-India average for 2019-21 was 23.3% — a very high percentage by any canon. However, eight states showed even higher percentages: Rajasthan, Andhra Pradesh, Telangana, Chhattisgarh, Bihar, West Bengal, Assam and Tripura.
c) Women of 15-19 years who were mothers or pregnant: The all-India average for 2019-21 was a reasonable 6.8%. Ten states, however, had larger percentages: Maharashtra, Andhra Pradesh, Bihar, Jharkhand, West Bengal, Odisha, Assam, Manipur, Meghalaya and Tripura. Tripura’s was 21.9%—or over a fifth of 15-19 year old women were either mothers or pregnant. West Bengal’s was 16.4%.
Also read: Brace for extreme weather
Economic indicators
Finally, I examined five economic indicators, of which one, per capita state domestic product, was from the Central Statistical Organisation. These were:
a) Per capita state domestic product, nominal, 2019-20: The number for India was Rs.151,760. Fourteen states were worse off, of which 11 were in central, eastern and north-eastern India.
b) Households with electricity connections: For India as a whole it was 96.8%. Six states fared poorer: Uttar Pradesh, Chhattisgarh, Bihar, Arunachal Pradesh, Assam and Meghalaya.
c) Households with piped/improved drinking water at source: The average for India was 95.9%. Sixteen states were worse off, dominated by central, eastern and north-eastern India.
d) Households with improved sanitation facility: For India, this was 70.2%. Nine states were poorer off: Jammu & Kashmir, Uttar Pradesh, Madhya Pradesh, Bihar, Jharkhand, West Bengal, Odisha, Assam and Manipur.
e) Households using clean fuel for cooking: The all-India average was 58.6%. Fourteen states were worse off — once again dominated by central, eastern and north-eastern India.
Also read: Linking rural producers with value chains
Putting it together
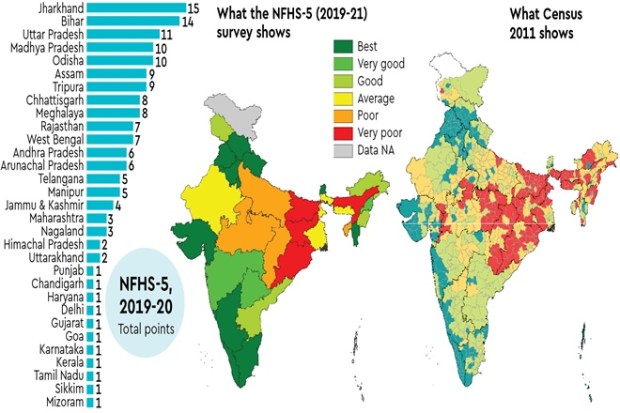
In aggregating the 15 indicators discussed in this series to arrive at a single number for each state, I avoided any artificial weighting and instead used a simple technique. If, for any indicator, a state was worse than the corresponding all-India number it was given the number 1; and zero otherwise.
Hence, the state with the largest number of 1s was the worst off. This method yields the in the accompanying graphic.
By far, the worst off is Jharkhand, which is worse than India in all 15 variables. It closely followed by Bihar at 14. For Uttar Pradesh, 11 of the 15 indicators are worse than that of India’s; for Madhya Pradesh and Odisha, 10 indicators are worse off; for Assam and Tripura, there are nine; eight for Chhattisgarh and Meghalaya; and seven for Rajasthan and West Bengal. Barring Uttar Pradesh and Rajasthan, the worse-off states are in central, eastern and north-eastern India. It shows clearly in the accompanying maps.
The tragedy of the NFHS map is that, relatively speaking, it is hardly different from the one that is constructed out of the household survey data from the 2011 census (see graphic). The picture was no different in the 2001 Census. This, then, is the major tragedy of India. Of the country’s centre, east and much of the north-east being consistently left behind—while the west, the south and the north steadily move ahead. This, more than anything else, is the country’s greatest challenge of economic governance. One can only ignore it to its political peril.
(The first part of this series appeared yesterday)
The writer is chairman, CERG Advisory