




Over the last few months, the banking sector has been quietly consolidating its position. Market participants have concentrated mostly on the larger indices and the more well-known private banks, but now a few mid-sized banking names are setting up nicely from a technical perspective. Two such stocks which have recently broken out on charts are RBL Bank and Federal Bank.
These breakouts are important as both these stocks are trading above their critical moving averages and the 20-EMA (Blue) is above the 50-EMA (Red) which is a classic sign of bullish momentum. Let’s get into the technical composition of these stocks and why traders may want to keep them on their radar.
RBL Bank: Breakout from consolidation
RBL Bank has pulled off a spectacular turnaround from its 2025 lows and has been making higher highs and higher lows consistently.
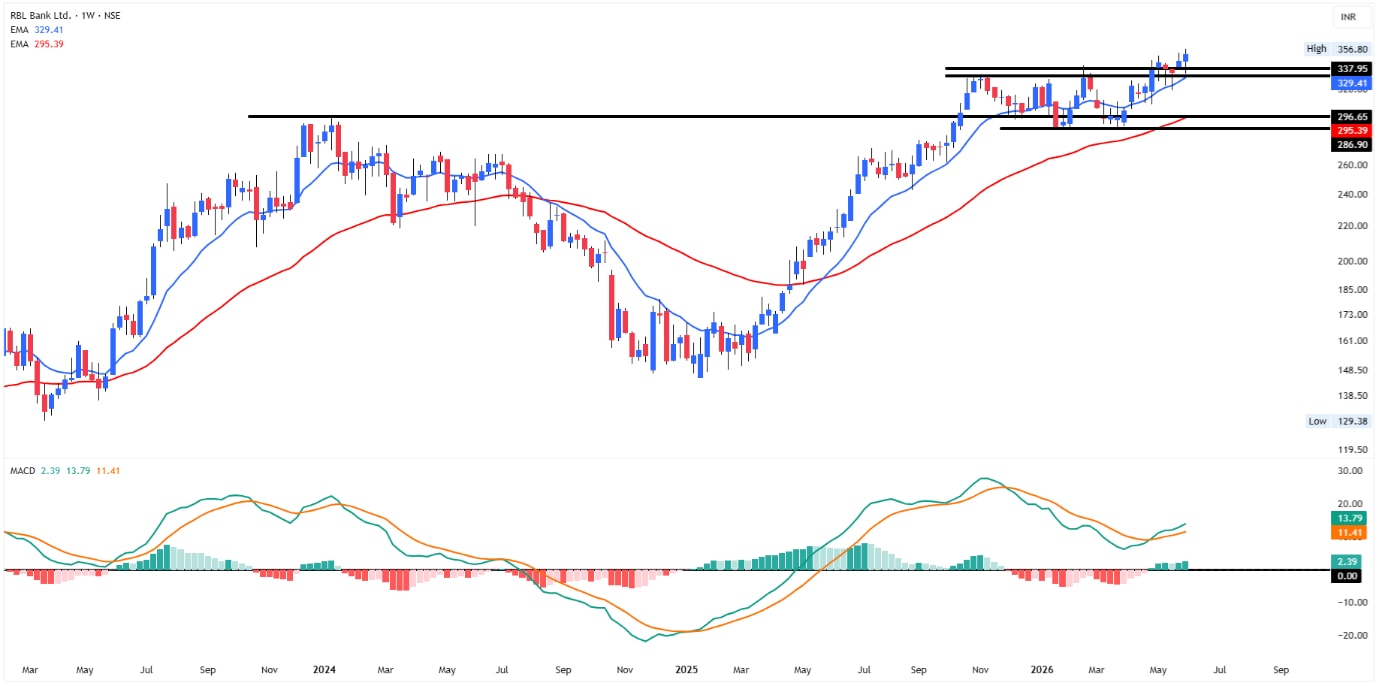
The stock after a strong rally, entered a consolidation phase around the Rs.300-340 zone, helping the shorter-term moving averages to catch up with the price.
The recent breakout above the consolidation range of around Rs.338 is significant for several reasons:
- The 20-EMA is still above the 50-EMA confirming a bullish trend structure.
- The breakout follows a period of sideways movement that is often viewed as a healthy pause in an uptrend.
- The MACD has turned higher and is crossing above the signal line suggesting increasing positive momentum.
The breakout zone of Rs 330-338 can now act as a crucial support zone from the trading point of view. The stock needs to stay above this zone for the path of least resistance to be upward.
The price structure shows buyers will accumulate at higher levels, a characteristic often seen in the early stages of trend continuation.
Federal Bank: New Lifetime High Breakout
The stock price of Federal Bank has been consolidating for a couple of months below the resistance zone of Rs.302. Whenever it attempted to get above this level, it was sold so it was a good resistance zone.
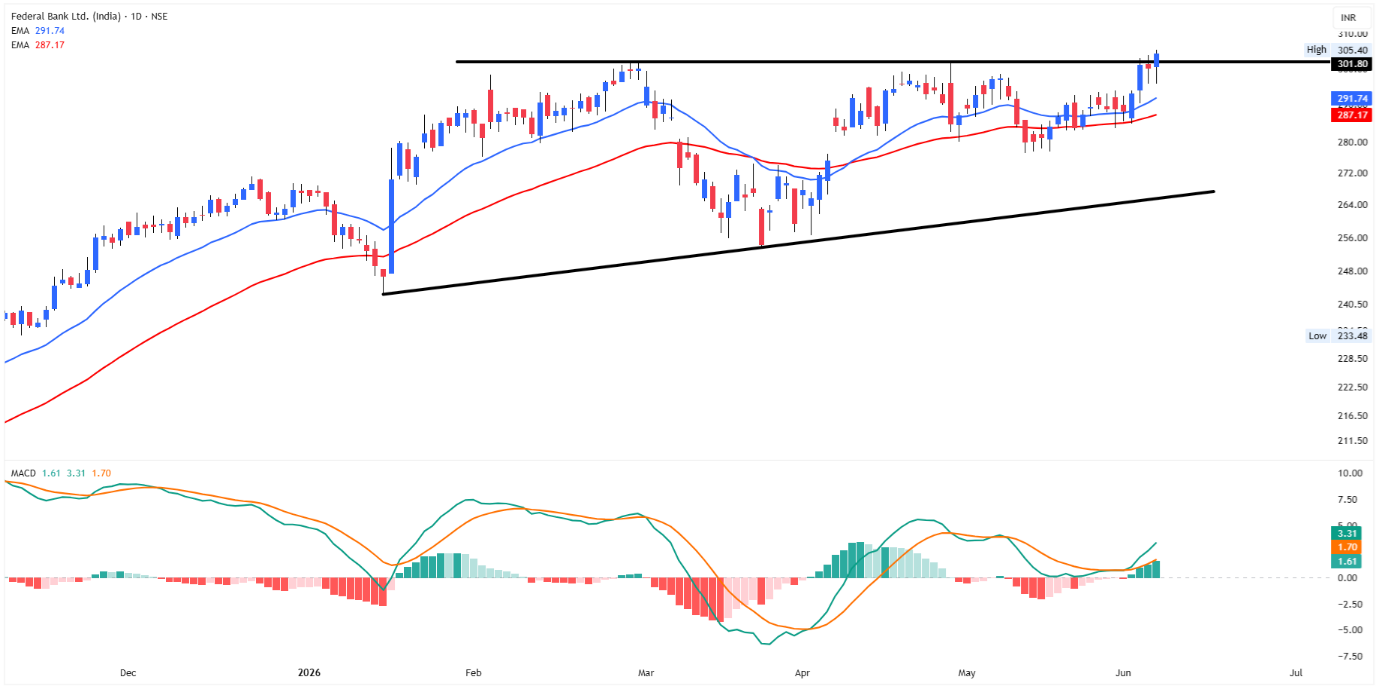
The recent move above Rs 302 changes the technical picture quite a bit.
Some key observations:
- The stock has broken out of multi-month resistance.
- The price is trading above the 20-EMA and 50-EMA and is positively aligned.
- MACD has crossed above the zero line, creating a bullish crossover.
One of the more encouraging details of this chart is the long-term ascending trendline connecting higher lows. This is a sign that institutional buying interest has been sustained during corrections.
When long consolidations break out, it often attracts new activity from momentum traders and trend followers. If the stock stays above the breakout level, it might see more upside in the coming weeks.
The Chart Structure Actionable Investors
There are three common characteristics of successful breakouts:
- Price above key moving averages.
- A good resistance breakout
- Momentum confirmation using indicators like MACD
At present, both RBL Bank and Federal Bank have these features.
If you are chasing every market move, you may be better off concentrating on stocks that have a combination of trend strength and breakout confirmation. Stocks trading above their 20-EMA and 50-EMA are often a sign that buyers are in control. Breakouts from consolidation zones can signal the start of a new price expansion phase.
With the affordable risk and the stock price in uncharted territory, the risk-reward seems favourable for investors.
Disclaimer:
Note: The purpose of this article is only to share interesting charts, data points and thought-provoking opinions. It is NOT a recommendation. If you wish to consider an investment, you are strongly advised to consult your advisor. This article is strictly for educative purposes only.
Brijesh Bhatia is an Independent Research Analyst and is engaged in offering research and recommendation services with SEBI RA Number – INH000022075. He has two decades of experience in India’s financial markets as a trader and technical analyst.
Disclosure: The writer and his dependents do not hold the stocks discussed here.
The website managers, its employee(s), and contributors/writers/authors of articles have or may have an outstanding buy or sell position or holding in the securities, options on securities or other related investments of issuers and/or companies discussed therein. The content of the articles and the interpretation of data are solely the personal views of the contributors/ writers/authors. Investors must make their own investment decisions based on their specific objectives and resources, and only after consulting such independent advisors if necessary.