")
Talking about Benjamin Graham to investors is a bit like talking about Sachin Tendulkar to cricket fans. The name carries weight before the discussion even begins. Graham is widely known as the father of value investing. His work shaped the idea of buying stocks with a margin of safety. He also influenced some of the world’s best-known investors, including Warren Buffett.
Graham’s defensive investor test was meant for investors who wanted discipline over excitement. It was not built around market tips or quick rallies. It was a checklist to avoid weak, risky or overpriced businesses. The seven tests were:
- Adequate size of the enterprise: Graham wanted to avoid very small companies and preferred businesses with sufficient scale.
- Strong financial condition: For industrial companies, he wanted current assets to be at least twice current liabilities.
- Earnings stability: The company should have reported some earnings in each of the past 10 years.
- Dividend record: The company should have paid dividends without interruption for at least 20 years.
- Earnings growth: Per-share earnings should have risen by at least one-third over 10 years, using three-year averages at the beginning and end.
- Moderate price-to-earnings ratio: The stock price should not be more than 15 times the average earnings of the past three years.
- Moderate price-to-assets ratio: The stock should not be more than 1.5 times book value, while PE multiplied by price-to-book should not exceed 22.5.
However, the test needs some care in India. Graham himself treated industrial companies and public utilities differently. This shows that the same balance-sheet test cannot be applied blindly to every type of business.
In the Indian context, banks, NBFCs, insurers, REITs and InvITs have different financial structures. Their balance sheets and valuation ratios work differently. Therefore, they have been excluded while applying the test.
For this article, companies were first shortlisted on Screener. The filters included market capitalisation above Rs 5,000 crore, current assets at least twice current liabilities, positive profits, PE of up to 15, price-to-book value of up to 1.5, PE multiplied by price-to-book not exceeding 22.5, positive latest quarterly EPS and dividend yield above zero. After the screen, companies were manually checked for 10-year profits, dividend history and Graham’s three-year average EPS growth test.
These are the companies that made the list after applying the above mentioned filters.
| S.No. | Name |
| 1 | Gujarat Narmada Fertilisers and Chemicals |
| 2 | Gujarat State Fertiliser and Chemicals |
| 3 | KRBL |
| 4 | Maharashtra Seamless |
| 5 | PNC Infratech |
| 6 | PTC India |
In this article we take a detailed look at GNFC, KRBL and PNC Infratech.
#1 Gujarat Narmada Fertilisers Company: Balancing Chemical Volatility with Value Multiplexing
Gujarat Narmada Valley Fertilizers & Chemicals Limited (GNFC), is a joint sector enterprise promoted by the Gujarat State Investments (GSIL), and the Gujarat State Fertilizers & Chemicals Ltd.(GSFC).
The company operates businesses mainly in the industrial chemicals, fertilizers apart from the small presence in IT services. In the chemical segment, it has a product portfolio of various bulk chemicals that are used in industries for manufacturing various specialty chemicals as well as end products.
Chemical Segment Rebound Offsets Flat Topline Sales
GNFC ended FY26 with a recovery in profitability, even as sales remained slightly lower. Consolidated sales stood at Rs 7,773 crore, down 1.5% year-on-year (YoY). Net profit rose 35.1% to Rs 808 crore. The March quarter was stronger, with sales rising 7.4% YoY to Rs 2,208 crore and net profit increasing 87.7% to Rs 396 crore.
The improvement was mainly led by the chemicals business. Management said chemical realisations improved during the quarter. Toluene Diisocyanate (TDI), ammonium nitrate and technical grade urea (TGU) drove the sequential improvement. Fertiliser remained under pressure, as urea fixed-cost revision and energy norm revision are still pending.
Raw material volatility remains a risk. Methanol production was not viable because of high gas prices. GNFC is evaluating whether to buy methanol for captive acetic acid production or directly source acetic acid for ethyl acetate.
TGU was another key area. The company raised production after war-related disruption, as diesel exhaust fluid demand became important for logistics. It produced more than 2.10 lakh tonnes of TGU in FY26. Management said the move was appreciated by government departments and the automobile industry.
Strategic Capex Pipelines Mitigate Raw Material Gas Volatility
The main capex pipeline includes ammonia expansion, weak nitric acid and ammonium nitrate melt. These projects are largely on track, though weak nitric acid has seen a delay of around two-and-a-half months. The coal-based captive power project is expected to be synchronised in June 2026, with full availability after the August test run.
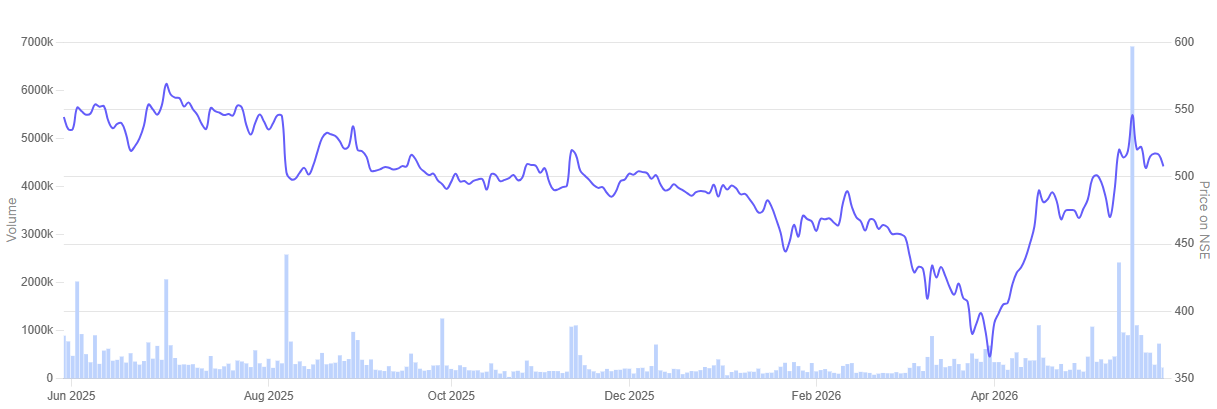
For a Graham-style defensive screen, GNFC fits the broad frame of an old operating company with scale, dividend history and low valuation. Its PE stands at 9.4 times and price-to-book at 0.8 times. The PE and PB product remains below Graham’s 22.5 threshold. EV/EBITDA is at 4.7 times, against its five-year level of 5.1 times. ROCE stands at 12.0%, while ROE is 9.13%.
Chemical prices, gas costs, methanol availability and pending fertiliser policy revisions can affect earnings. Still, the FY26 numbers and March quarter recovery make GNFC a relevant Graham-screen candidate. The key question is whether the recent earnings strength can hold through the commodity cycle.
In the last year, the share price of GNFC is down 6.6%.
GNFC 1 Year Share Price Chart
#2 KRBL: Domestic Branded Resilience Offsets Export Volatility
KRBL is world’s leading basmati rice producer and has fully integrated operations in every aspect of basmati value chain, right from seed development, contract farming, procurement of paddy, storage, processing, packaging, branding and marketing.
KRBL closed FY26 with steady growth, led by its domestic branded rice business. Total income stood at Rs 6,168 crore, up 9% YoY. Net profit grew 36.1% YoY to Rs 698 crore. The company said domestic revenue grew 10%, mainly driven by 8% branded rice volume growth, while export revenue grew 6%.
For Q4 FY26, total income stood at Rs 1,526 crore, up 6% YoY. PAT stood at Rs 155 crore, compared with Rs 154 crore a year earlier. Domestic revenue grew 22%, while export revenue declined 33% due to lower exports to the Middle East.
Domestic Packaged Dominance Drives Volume Growth Leadership
The domestic business was the clear driver. Growth was led by 16% rice volume growth and 5% improvement in realisation. For FY26, domestic revenue excluding power stood at Rs 4,444 crore, up 10%. Branded basmati grew 9%, while branded non-basmati grew 38% to Rs 271 crore.
KRBL also retained strong channel leadership. Management said the company held 36.9% share in general trade, 38.7% in modern trade and 40.1% in e-commerce for packaged basmati rice. Its retail reach has expanded to 3.4 lakh outlets, while it is reaching 1.2 crore urban Indian households.
Geopolitical Disruptions Drag Quarter Export Revenue Down 33%
Exports were the weak spot in the quarter. Q4 export revenue fell to Rs 279 crore from Rs 450 crore a year earlier. The decline was mainly due to geopolitical disruption, higher freight costs and logistics bottlenecks in the Middle East. However, FY26 export revenue still grew 6% to Rs 1,555 crore.
The company is also widening its portfolio beyond basmati. It launched new India Gate Classic masala meal mixes during the quarter. Its edible oil business remained small at Rs 12 crore in FY26, but management expects it to scale as distribution improves. The Uplife health rice range is also being pushed through brand and digital campaigns.
KRBL is not treating real estate as a core growth engine. Management said the rice business remains the main focus. The Samalkha land parcel is being evaluated for monetisation or development. A 60-acre portion is being considered for the company’s own warehousing needs near Sonipat.
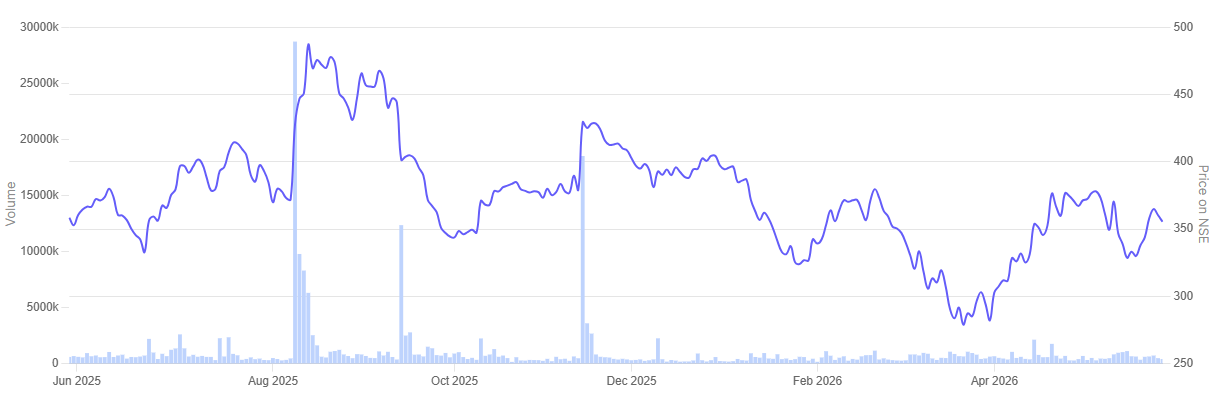
For a Graham-style defensive screen, KRBL fits the broad frame of an old operating company with a steady consumer-facing business, dividend history and moderate valuation. Its PE stands at 12.6 times and price-to-book at 1.4 times. The PE and PB product remains below Graham’s 22.5 threshold. EV/EBITDA is at 8.4 times, in line with its five-year EV/EBITDA of 8.4 times. ROCE stands at 15.2%, while ROE is 11.7%.
The key risk is export volatility. Freight costs, insurance premiums, Middle East disruptions and basmati price movements can affect quarterly performance. Still, KRBL’s domestic brand strength and balance-sheet comfort make it a relevant candidate under a Graham defensive-investor screen. The question is whether domestic growth can keep offsetting export swings in FY27.
In the last year, the share price of KRBL is down 0.5%.
KRBL 1 Year Share Price Chart
#3 PNC Infratech: Monetizing Order Books Amidst Structural Execution Delays
PNC Infratech was incorporated as PNC Construction Company Private Limited. The company was converted into a limited company in 2001 and was renamed PNC Infratech limited in 2007. PNC Infratech is one of the front-ending infrastructure development, construction, and management companies in the country.
PNC Infratech closed FY26 with lower revenue but a stable profit base. Consolidated revenue stood at Rs 5,368 crore in FY26 significantly lower compared to Rs 6,769 crore. Consolidated PAT stood at Rs 832 crore, up about 2.1% YoY. For Q4 FY26, consolidated revenue stood at Rs 1,617 crore lower from Rs 1,704 crore reported a year ago. Profit came in at Rs 108 crore up 44% YoY.
Structural Commencement Delays Compress Fiscal Execution Turnovers
The year was affected by slower execution in some projects. Management said four projects, including three National Highways Authority of India (NHAI) projects and one Madhya Pradesh Road Development Corporation (MPRDC) project, faced delays in commencement. This led to lower turnover in FY26. However, the company expects execution to improve in FY27, with standalone revenue guidance of around Rs 6,000 crore and around Rs 7,500 crore in FY28.
The order book remains the main comfort. PNC’s unexecuted order book stood at over Rs 22,000 crore. Highways contributed 62% of the order book. Water, canal, area development, railway and airport projects contributed around 25%, while coal mining contributed 13%.
Diversifying Order Books Beyond Highways Into Solar Storage
PNC is also widening its infrastructure exposure beyond roads. Management pointed to opportunities in renewable energy, battery storage, power transmission, water supply, irrigation, railways, metro, airports, logistics and mining. The company is targeting total order inflows of around Rs 15,000 crore in FY27, with 60-70% expected from highways and the balance from non-road sectors.
The solar and storage business is also moving ahead. Physical execution of the solar project is expected to begin from the third quarter of FY27. The company is targeting around Rs 600 crore revenue from solar in FY27 and Rs 1,400 crore in FY28. In mining, it reported Rs 68 crore revenue in FY26 and expects around Rs 400 crore in FY27.
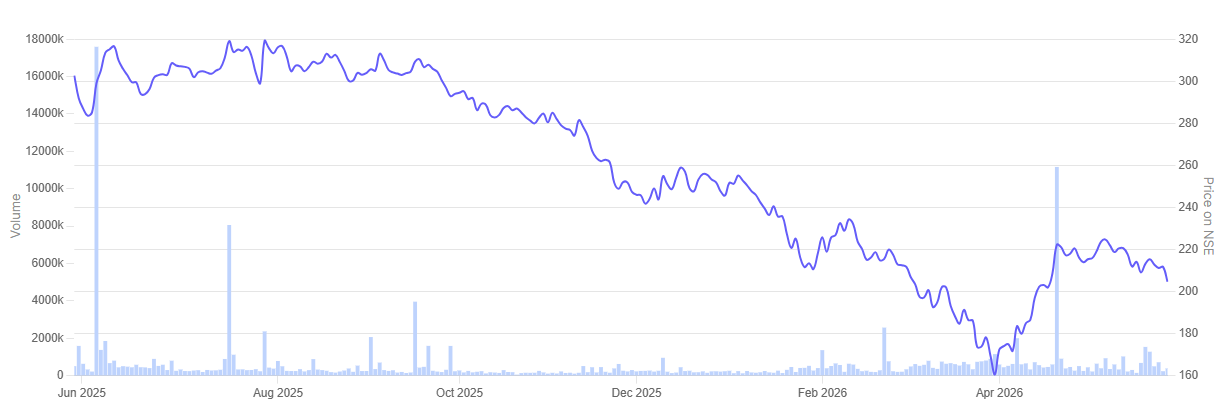
For a Graham-style defensive screen, PNC fits the frame as an old listed operating company with a large order book, positive earnings record and moderate valuation. Its PE stands at 11.9 times and price-to-book at 0.8 times. The PE and PB product remains below Graham’s 22.5 threshold. EV/EBITDA is at 6.5 times, compared with its five-year EV/EBITDA of 6.9 times. ROCE stands at 8.5%, while ROE is 7%.
The main risk is execution. Delays in appointed dates, land acquisition and payments can affect revenue visibility. Input cost inflation is another pressure point, especially bitumen and fuel. Still, PNC’s order book, low standalone leverage and sector diversification make it a relevant candidate under a Graham defensive-investor screen. The key question is whether execution can catch up in FY27.
In the last year, the share price of PNC Infratech is down 32.3%.
PNC Infratech 1 Year Share Price Chart
Conclusion
Graham’s screen is strict by design. It filters out most companies and leaves only those with a long record, steady profits, dividends and reasonable valuations.
But passing the screen is not the same as being a buy. Each stock still has its own risks. Chemicals are cyclical. Rice exports depend on global trade. Infrastructure depends on execution and payments.
So this is only a starting point. The real question is whether these businesses can protect earnings and dividends through a full cycle.
You can track how these are progressing by adding stocks to your watchlist.
Disclaimer:
Note: We have relied on data from www.Screener.in throughout this article. Only in cases where the data was not available, have we used an alternate, but widely used and accepted source of information.
The purpose of this article is only to share interesting charts, data points and thought-provoking opinions. It is NOT a recommendation. If you wish to consider an investment, you are strongly advised to consult your advisor. This article is strictly for educative purposes only.
Ekta Sonecha Desai has a passion for writing and a deep interest in the equity markets. Combined with an analytical approach, she likes to deep dive into the world of companies, studying their performance, and uncovering insights that bring value to her readers.
Disclosure: The writer and her dependents do not hold the stocks discussed in this article.
The website managers, its employee(s), and contributors/writers/authors of articles have or may have an outstanding buy or sell position or holding in the securities, options on securities or other related investments of issuers and/or companies discussed therein. The content of the articles and the interpretation of data are solely the personal views of the contributors/ writers/authors. Investors must make their own investment decisions based on their specific objectives, resources and only after consulting such independent advisors as may be necessary.