
")
In this series of market insights, we have already covered how market intermediaries can act like toll booths and why exchanges like BSE, MCX and IEX behave like compounding machines. This is the third piece in that seres.
India’s securities markets have expanded sharply over the past few years. Equity participation has widened. Trading volumes have surged across cash and derivatives. More households are now linked to markets, directly or through platforms. This growth has not been linear, but the direction has been clear.
At the centre of this expansion sit brokerage houses. They act as the bridge between investors and the market. Every trade, whether in equities, derivatives or other instruments, flows through them. As participation rises, their role becomes more visible. Their revenues move with volumes, activity and client engagement.
Brokerage businesses are therefore becoming structurally more important in India’s financial ecosystem. Retail participation continues to grow, and the range of market products has widened over time. As more savings move into financial assets, brokerage platforms are likely to remain an important access point for investors, even as rules and trading conditions keep changing. Over time, scale, adaptability and business mix will decide who consolidates their position.
Against this backdrop, it becomes useful to look at brokerage houses that have delivered sustained growth. In this article, we examine leading listed brokers with a market capitalisation of Rs 1,000 crore or more, ranked by their five-year sales growth. The focus is on companies where broking is a meaningful business driver.
Top Brokerage Houses on India
| S.No. | Name | 5 Year Sales CAGR (%) |
| 1 | Angel One | 48% |
| 2 | Share India Securities | 45% |
| 3 | Nuvama Wealth Management | 40% |
| 4 | Dam Capital Advisors | 40% |
| 5 | Monarch Networth Capital | 36% |
| 6 | Master Trust | 34% |
While DAM Capital Advisors featured in the initial screen, it has been excluded as investment banking dominates its operations. Instead, Master Trust has been included to keep the analysis centred on brokerage-led businesses. The list offers a window into how India’s broking landscape is shaping up.
#1 Angel One – Retail Scale Drives Five-Year Growth
Angel One is a diversified financial services company and is primarily engaged in the business of stock, commodity and currency broking, institutional broking, providing margin trading facility, depository services and distribution of mutual funds, lending as a non-banking finance company (NBFC) and corporate agents of insurance companies.
Angel One has emerged as one of the fastest-scaling retail brokerage platforms over the past five years, supported by rising market participation and steady client acquisition. Consolidated revenue rose from Rs 1,289 crore in FY21 to Rs 5,239 crore in FY25. Net profit over the same period increased from Rs 297 crore to Rs 1,172 crore, alongside a steady rise in business volumes.
The momentum, however, has moderated in the current year. In Q2 FY26, gross revenue stood at Rs 1,202 crore up 26% year-on-year (YoY). Profit after tax fell to Rs 212 crore in Q2 FY26 from Rs 423 crore a year earlier. Revenue was lower during the quarter, as trading activity slowed and transaction fee rebates ended from October 2024.
Even so, the company continued to add clients and increase its share across both cash and derivatives segments. Its client base crossed 340 lakh, with a large share coming from non-metro regions. The company is also broadening its business mix through wealth management, asset management, credit distribution and a proposed insurance joint venture.
A GIFT City branch is planned, subject to regulatory approvals. The company has taken a cautious view on the near term, while continuing to position itself for growth over a longer period as more savings move into financial markets and its product range expands.
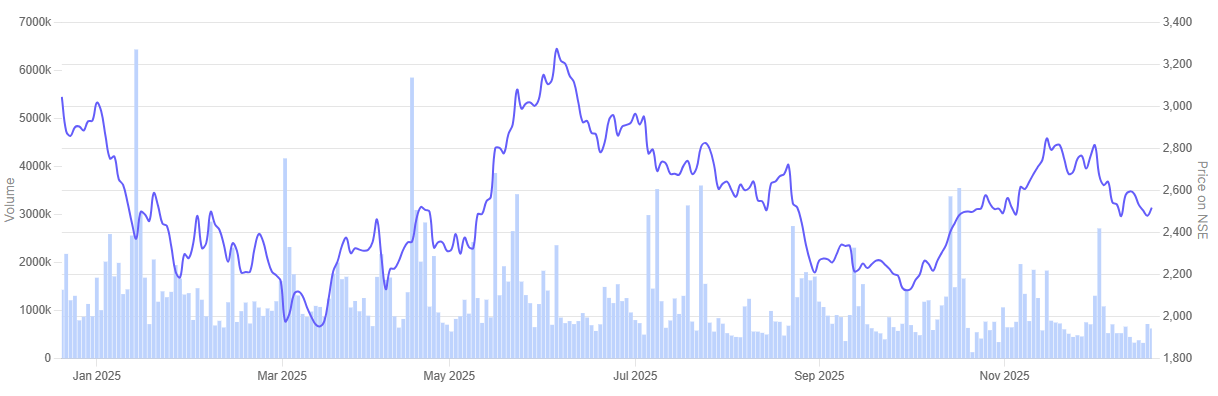
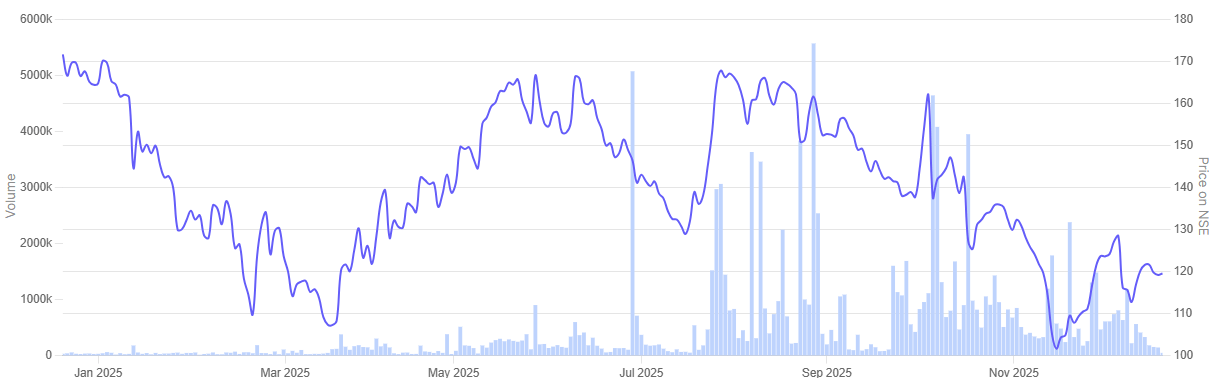
In the past one-year Angel One share price is down 17.3%.
Angel One 1-Year Share Price Chart
#2 Share India Securities – Technology-Led Expansion Beyond Core Broking
Share India Securities is a financial service provider that uses technology to offer customized capital market tech-based solutions to clients. It offers financial products & personalized services, including equity broking, currency & commodity derivative, depository participant services, mutual fund advisory and distributorship, etc to retail and corporate clients.
Over the last five years, Share India Securities has expanded its business beyond core broking. Revenue increased from Rs 453 crore in FY21 to Rs 1,449 crore in FY25 as the company widened its presence across capital-market activities. Net profit increased from Rs 81 crore to Rs 328 crore over the same period, aided by higher operating margins and a growing mix of non-broking income streams.
However, the current year reflects the impact of regulatory changes across the broking industry. In Q2 FY26, revenue declined to Rs 341 crore as compared to Rs 453 crore reported Q2 FY25 as tighter derivative norms and lower trading volumes weighed on activity. For Q2 FY26, profit after tax declined to Rs 93 crore in contrast to Rs 124 crore reported in Q2 FY25. Management noted that volumes have stabilised over the past two quarters, with no further regulatory shocks anticipated in the near term.
On the operations side, the company is building out new lines of business. Its margin trading book is being scaled up, with management aiming to take assets to about Rs 1,000 crore by December 2027. A PMS business is set to launch, with AIFs planned next.
Project Drone, a digital WealthTech platform, is expected to go live in Q4 FY26. Branch expansion across central and western India is also underway. Management remains cautious in the short term but sees medium-term growth driven by diversification and technology-led services.
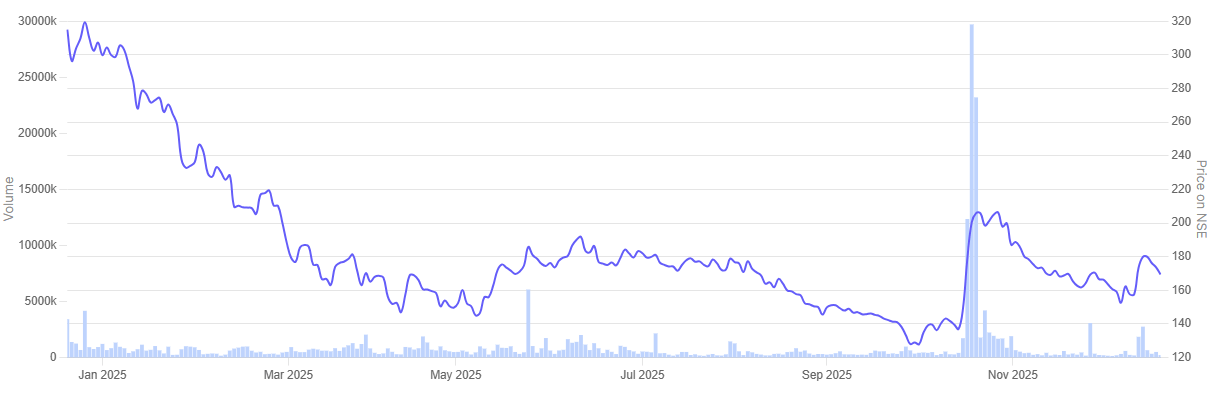
In the past year Share India Securities share price tumbled 46.3%.
Share India Securities 1-Year Share Price Chart
#3 Nuvama Wealth Management – Shift Towards Wealth and Recurring Income
Incorporated in 1993, Nuvama Wealth Management is in the business of broking and trading in equity securities and is also registered as an Investment Adviser and Merchant Banker with SEBI.
Nuvama Wealth Management has built a strong growth profile over the past five years, driven by diversification beyond capital markets. Consolidated revenue increased from Rs 1,384 crore in FY21 to Rs 4,162 crore in FY25, implying a five-year sales CAGR of about 40%. Net profit rose from a loss in FY21 to Rs 985 crore in FY25, supported by a sharp improvement in operating margins and a rising share of recurring income.
In the current year, performance has remained resilient despite volatility. In Q2 FY26, consolidated revenue grew 7.8% YoY to Rs 1,135 crore, while profit after tax stood at Rs 254 crore a little lower compared to Rs 257 crore reported in Q2 FY25. Growth was led by the Wealth and Private businesses, which together accounted for 57% of revenue, up from 47% a year earlier. Capital markets activity remained uneven following regulatory changes in derivatives.
Operationally, Nuvama continues to scale its platform. Client assets stood at about Rs 4.4 lakh crore. Managed products and investment solutions now form the core of the wealth business. International operations in Dubai have reached breakeven, while a Singapore presence has been added.
The company is also awaiting approvals for a mutual fund license, which could widen its addressable market. Management remains cautious in the near term but expects growth to normalise as market activity stabilises.
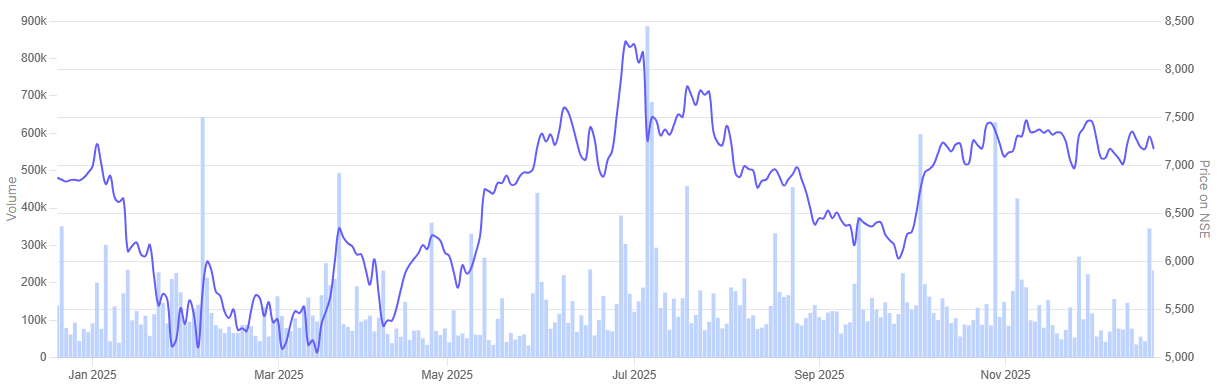
In the past one-year Nuvama Wealth Management share price is up 4.3%.
Nuvama Wealth Management 1-Year Share Price Chart
#4 Monarch Networth Capital – Steady Growth from Broking and Advisory Mix
Monarch Networth Capital is a provider of financial services in pure stock broking, primary market operations, mutual funds, insurance and financial planning. It is a strategic amalgamation of two financial service providers Monarch Group of Companies and Networth Stock Broking.
Monarch Networth Capital has built a steady brokerage and capital-markets franchise over the past five years, supported by expanding retail participation and a broader product mix. Revenue rose from Rs 103 crore in FY21 to Rs 328 crore in FY25 resulting in a CAGR growth of 36% over the past five years. Net profit climbed sharply over the same period, reaching Rs 149 crore in FY25 from Rs 24 crore in FY21, reflecting operating leverage and tighter cost control.
The last year marked a clear step-up in scale. Q2 FY26 revenue dropped to Rs 83 crore from Rs 104 crore YoY. On the other hand net profit rose marginally to Rs 45 crore from Rs 44 reported in Q2 FY25.
Recently, Monarch continued to strengthen its institutional and wealth management platforms. The company continues to use its GIFT City setup as a base for offshore and cross-border business, though overseas contributions are still modest. There were no large acquisition announcements during the period, with the focus remaining on organic growth and widening the client base.
Recent SEBI rule changes and adjustments in brokerage payouts have, however, weighed on growth in the near term. Still, Monarch enters the next phase with a stronger balance sheet and improved earnings visibility.
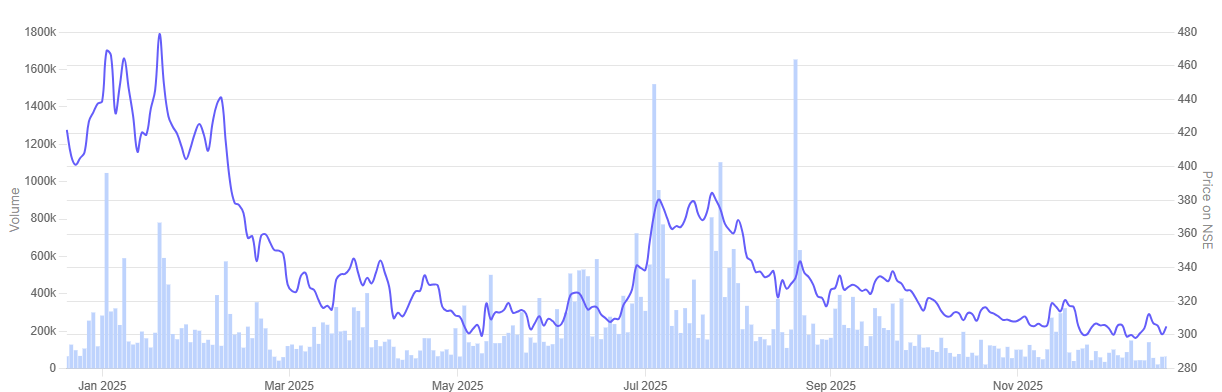
In the past one-year Monarch Networth Capital share price tumbled 28.1%.
Monarch Networth Capital 1-Year Share Price Chart
#5 Master Trust – Smaller Platform Scaling Up Through Digital and Merchant Banking
Incorporated in 1985, Master Trust is in the business of lending, sales /purchase of securities and lands.
Master Trust has delivered a steady expansion over the past five years, supported by scale-up across retail broking, wealth management and digital platforms. Consolidated revenue rose from about Rs 225 crore in FY21 to Rs 584 crore in FY25, reflecting a five-year sales CAGR of over 30%. Net profit during this period increased from Rs 34 crore to Rs 131 crore, helped by operating leverage, rising client activity and improving product mix.
Q2 FY26 was a slow quarter. Revenue dropped from Rs 154 core to Rs 127 crore YoY, and net profit also dropped from 37 crore in Q2 FY25 to Rs 31 crore reported in Q2 FY26. The impact was visible across core broking revenues as trading volumes remained subdued. The quarter reflected the wider slowdown seen across the brokerage industry following recent regulatory tightening.
During FY25, Master Trust completed a direct listing on the NSE, enhancing visibility and access to capital markets. The company also expanded its merchant banking portfolio with new mandates and continued investment in digital platforms such as Agnik, mtWealth and SinglePoint.
Looking ahead, growth is expected to be driven by deeper retail penetration, rising financialisation and continued digital adoption, even as regulatory changes moderate near-term brokerage yields.
In the past one-year Master Trust share price nose-dived 30.7%.
Master Trust 1-Year Share Price Chart
Impact of Regulatory Changes on Indian Brokerage Houses
The broking sector went through a clear shift in FY25 as SEBI rolled out a set of regulatory changes. The intent was to make markets cleaner and safer for investors. In the process, the rules have also changed the way brokers generate income, how traders participate in the market and how risk is handled across the system.
One of the most material shifts was the move to a uniform, “true-to-label” transaction fee structure from October 2024. All exchange charges now have to be passed through without discounts. In the past, higher volumes helped brokers earn additional rebates. That source of income is no longer available. Several platforms have since introduced small per-trade fees to offset the impact.
SEBI also overhauled the framework governing payments by mutual funds to intermediaries. The regulator proposed a 15-basis-point cut in the total expense ratio, but finally approved a lower 10-basis-point reduction across asset slabs. It also removed the additional 5-basis-point allowance linked to exit loads. While the final rules were milder than feared, they still reduced the scope for AMCs to pay brokerage and distribution fees.
Derivatives trading faced sharper tightening. Contract sizes were increased, weekly expiries were restricted and margin norms were tightened, especially on expiry days. Calendar spread benefits were withdrawn. These changes led to a visible drop in speculative activity and lower turnover intensity per client.
Operational reforms such as direct securities settlement, optional T+0 trades and the blocked-fund framework improved safety but raised compliance and technology costs.
In the near term, brokerage earnings have come under strain. Trading volumes have softened. Fee flexibility has narrowed. Compliance costs have moved higher. Put together, these changes have left less room for margins. The pressure is more visible at firms that depend largely on derivatives trading or distribution income.
Over time, the difference between business models may become clearer. Larger platforms are better placed to absorb costs. Firms that earn from areas like wealth or advisory tend to have steadier cash flows. Brokers that rely mainly on trading volumes could find it harder to maintain growth as the new rules settle in.
Valuations
Let us now turn to valuations of these brokerage houses, using the Enterprise Value to EBITDA metric.
Valuations of Brokerage Houses in India
| Sr No | Company | P/E | Industry Median | ROCE |
| 1 | Angel One | 29.2 | 20.61 | 25.8% |
| 2 | Share India Securities | 13.3 | 20.6% | |
| 3 | Nuvama Wealh Management | 25.4 | 20.4% | |
| 4 | Monarch Networth Capital | 15.6 | 33.3% | |
| 5 | Master Trust | 12.4 | 30.1% |
Valuations across this group are far from uniform. Angel One is valued above the sector median P/E of 20.6 times. Its size, wide retail reach and relatively stable earnings appear to be supporting this valuation. Nuvama Wealth too trades at a premium in line with their mixed business models and return ratios.
Monarch, Share India Securities and Master Trust are valued at much lower multiples despite generating decent returns. This points to a more cautious stance from the market on how steady their earnings can be going forward.
The gap in valuations also mirrors recent regulatory changes, with investors favouring larger, diversified platforms and taking a more guarded view on businesses that depend heavily on trading volumes.
While long-term trends such as financialisation and rising participation remain intact, current valuations already factor in a degree of future recovery for some names. As always, the key question is how much growth is already priced in, and whether near-term earnings pressures leave room for meaningful upside from here.
Conclusion
India’s brokerage industry has clearly entered a different phase. The last five years were marked by rapid expansion. More investors came in. Volumes rose sharply. Digital platforms scaled faster than expected. The companies discussed here were direct beneficiaries of that phase and managed to build meaningful businesses.
The environment today is less forgiving. Regulatory changes have altered revenue structures. Trading behaviour has shifted. Cost pressures have increased. Growth is no longer driven only by higher volumes or new accounts. The phase ahead will test how well brokers adjust to the new environment, not just how quickly they expanded in the past.
For investors, the lens has narrowed. Five-year growth numbers still matter, but they no longer tell the full story. Attention is shifting to how predictable earnings are and how companies operate under stricter rules.
Larger firms with stronger balance sheets and more than one source of income are likely to cope better. Others may find it harder to rebuild momentum. Even so, India’s long-term financialisation story remains intact, and brokerage houses will continue to play a central role in that journey.
Note: We have relied on data from www.Screener.in throughout this article. Only in cases where the data was not available, have we used an alternate, but widely used and accepted source of information.
Disclaimer:
The purpose of this article is only to share interesting charts, data points and thought-provoking opinions. It is NOT a recommendation. If you wish to consider an investment, you are strongly advised to consult your advisor. This article is strictly for educative purposes only.
Ekta Sonecha Desai has a passion for writing and a deep interest in the equity markets. Combined with an analytical approach, she likes to dig deep into the world of companies, studying their performance, and uncovering insights that bring value to her readers.
Disclosure: The writer and her dependents do not hold the stocks discussed in this article.
The website managers, its employee(s), and contributors/writers/authors of articles have or may have an outstanding buy or sell position or holding in the securities, options on securities or other related investments of issuers and/or companies discussed therein. The content of the articles and the interpretation of data are solely the personal views of the contributors/ writers/authors. Investors must make their own investment decisions based on their specific objectives, resources and only after consulting such independent advisors as may be necessary.