")

A company’s financial health is a crucial factor that long-term investors should always consider. Whether the company is likely to be profitable or not in the long run, how it uses leverage as a tool to grow, how much liquidity it has, and operational efficiencies are some of the factors that need to be considered when investing in a company for the long term.
Now you can do this all manually, or you could follow a simple pre-decided process to get your answer.
Yes, there is indeed a way you can do that. And it involves the calculation of what’s called the Piotroski Score or Piotroski F-Score. This indicator helps in rating companies as per their financial health. The score is calculated on a scale of 0-9, where 0-3 indicates poor financial health, and a higher score between 7-9 indicates a financially healthy company.
This score takes into account the profitability quotient of the company, the leverage the company has, and operational efficiencies. Investors can use this score to filter out companies with poor financial health and fundamentals.
Today, we are going to dig into three small-cap companies that have a Piotroski score of 9, the highest possible, depicting solid fundamentals and financial health.
#1 AGI Greenpac Limited (AGI)
AGI Greenpac Ltd. is engaged in the manufacturing and supply of Container Glass bottles. PET bottles, specialty glass, and security caps and closures. It is the second-largest player in the organized glass packaging industry in India, holding a market share of around 20% as per its installed capacity. The company sells its products under the brand names of AGI Brand for Glass Containers, GP Brand for PET Bottles, plastic products, and AGI Closures for security caps and closures.
The company has a Piotroski Score of 9, which indicates solid financial health.
Leading the Industry
AGI is an industry leader with a massive glass packaging manufacturing facility. This facility has a per-day capacity of over 1,800 tons, which is divided amongst its two manufacturing facilities at Sanathnagar and Bhongir in Telangana. The specialty glass facility has a capacity of 160 tons per day, and the caps and closures segment unit has a capacity of producing 1,154 million pieces in a year. Apart from the glass packaging, AGI also deals in plastic packaging, which has a capacity of 12,000 tons per year.
Strong Clientele
The company has a solid client list of over 500 companies across sectors and industries. Some of the big names on their client’s list include –
- Coca-Cola
- Dabur
- Glenmark
- Hindustan Unilever Ltd.
- Parle Agro
Solid long-term growth
The sales of AGI went up from ₹1,859 crore in FY20 to ₹2,529 crore in FY25, growing at 6% Compound Annual Growth Rate (CAGR). However, the company managed to grow its profit at a 47% CAGR during this period from ₹48 crore in FY20 to ₹322 crore in FY25. The base year, FY20, had a covid impact in the last quarter due to which there is a base effect in play here.
The average Return on Equity (ROE) for the last five years is 14% while the average Return on Capital Employed (ROCE) for the same period is 13.91%, both slightly higher than the industry medians.
The current ratio, which indicates the solvency quotient of the company or liquidity, is also at par with the industry median of 1.67x. The Debt-to-Equity (Debt/Equity) ratio is 0.26, lower than that of the industry median of 0.44.
The average operating profit margin (OPM) for the last five years is 21.85%, higher than the industry median of 11.15%, indicating the company’s solid operational efficiencies.
Way ahead
AGI is in the process of building a Greenfield 500-ton Glass Plant in Madhya Pradesh, which is expected to boost its manufacturing capacity by 25%. This is expected to be operational by March 2027.
The company has recently entered into the high-growth aluminum can production as well. For this, a new plant has been built in Uttar Pradesh, where the annual capacity is expected to be around 950 million by the second half of FY28, and it can even expand to 1.6 billion cans annually by FY30.
Valuation
The stock is currently trading at a Price Earnings (PE) ratio of 15.9x as compared to the industry median of 22.8x.
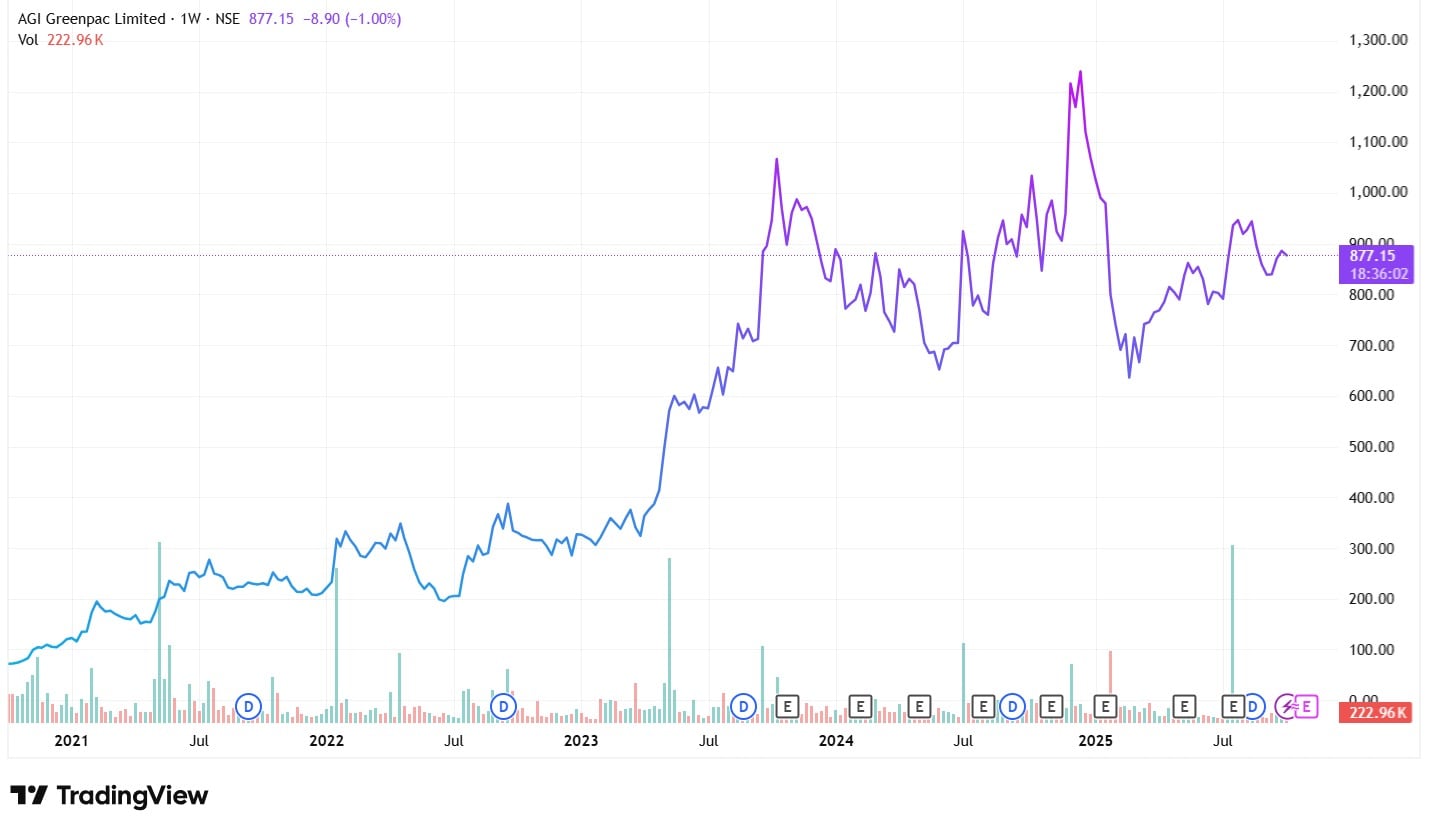
The share price has zoomed at a 64% CAGR in the last five years.
AGI Greenpac Share Price Chart (Rs)
#2 Madras Fertilizers Limited (MADRASFERT)
Madras Fertilizers Ltd. is a leading fertilizer manufacturer in India. The company’s main products are Urea and other complex fertilizers. It also sells Bio-fertilizers and eco-friendly agro chemicals, City compost, and organic manure under the Brand name of ‘Vijay’.
Madras Fertilizers also has a Piotroski Score of 9, depicting its excellent financial health. Let’s try to figure out what’s working in favor of the company.
Excellent operational efficiency
During FY25, the company’s production was higher than its own targets, suggesting better than expected operational efficiency. For instance, the annual production target for Ammonia was 2,92,000 MT while the actual production was 3,26,260 MT during FY25, which was 111.7% of the target capacity. Similarly, the Urea production stood at 108.6% of the target production.
However, this is not the first time that the company has been an overachiever; during FY23 also the actual production also surpassed the targets.
Sustainable development
Madras Fertilizers is working towards a sustainable future, joining hands with the Government of India. Under the PM Pranam Scheme, the company started organising 120 Kisan Sangohsthi from the beginning of FY26 to create awareness regarding the use of fertilizers. The goal here is to reduce the use of chemical fertilizers and adopt bio-fertilizers.
Solid fundamentals
The sales of the company grew from ₹1,292 crore in FY20 to ₹2,542 crore in FY25, a 14% CAGR. Since FY21, the company has been generating profits consecutively for all the fiscals until now. During FY25, it generated a profit of ₹64 crore.
The 5-year average ROCE of the firm is 17.9% which is higher than the industry median of 14.8%. The 5-year average OPM is at 7.8% at par with the industry median of 7.8%, indicating the operational efficiency of the fertilizer manufacturer.
The liquidity quotient, as indicated by the current ratio, however, looks poor in comparison to the industry peers. While Madras Fertilizers has a current ratio of 0.68, that of the industry is 1.41.
Valuation
The company is trading at a PE of 19.9x, lower than the industry median of 28.7x.
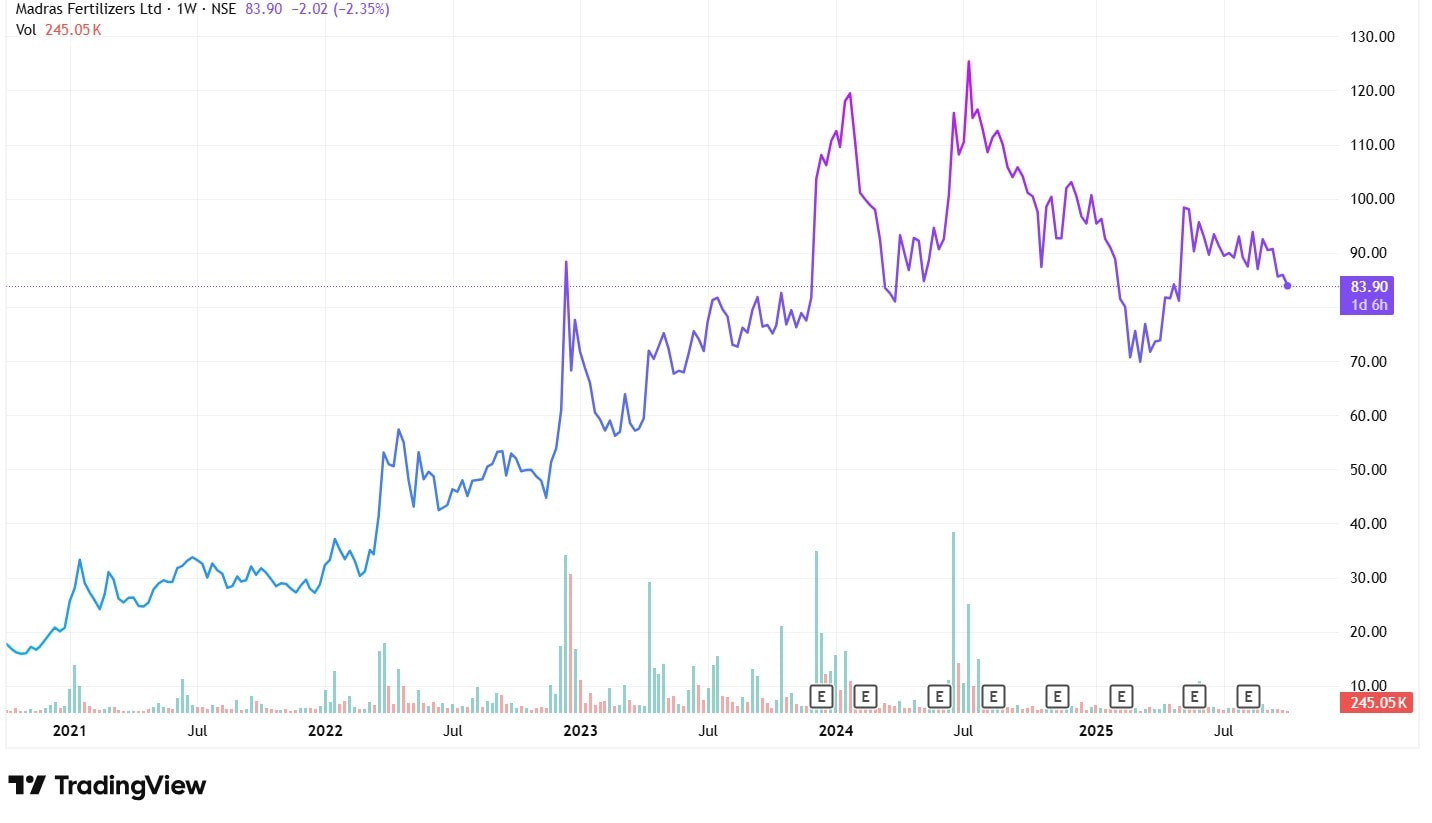
The stock price surged at a CAGR of 37% over the last five years.
Madras Fertilizers Share Price Chart (Rs)
#3 Mayur Uniquoters Limited (MAYURUNIQ)
Mayur Uniquoters Ltd. is into the manufacturing of fabrics, artificial leather, PVC Vinyl, which are primarily used in the textile and fashion industry.
The product portfolio of the company includes over 400 different variants of artificial leather, which are made from PVC-coated and PU-coated fabrics used across the footwear industry, and even in the automotive and furniture industries. While manufacturing is the primary business segment of the company, it is also engaged in the retail furnishing business with the Brand name of Texture and Hues.
This company, like the other two, has a Piotroski Score of 9 as well. Let’s see the reasons behind.
Global exposure
Mayur is one of the few Asian manufacturers and suppliers, apart from Chinese companies, that hold a strong position in the global market, especially for the fabric and leather products required in the Automotive industry. It claims to offer quality at a competitive cost, which makes it popular amongst Global Automotive businesses.
Massive domestic manufacturing capacity and growth prospects
This company has the largest capacity for synthetic leather production in the Indian organized leather market. Given the rise in the use of artificial leather over time, the company sees a massive growth prospect in this segment. Currently, as per the management’s estimates, it only contributes to 0.002% of the total artificial leather in supply.
Strong fundamentals
In FY20, the company’s sales stood at ₹516 crore, which in FY25 increased to ₹820 crore, growing at a 10% CAGR. The net profit for the period increased at a 12% CAGR from ₹81 crore in FY20 to ₹141 crore in FY25.
The average ROE for the last five years is 14.2%, way higher than the industry median of 4%. Similarly, the 5-year average ROCE is at 18.2%, again way higher than the industry figure of 6.8%.
The current ratio is 6.8 while that of the industry is 3.6, indicating that the company is highly liquid too. The debt/equity ratio is also at 0.01, way lower than the industry median of 0.09.
On the other hand, the operating efficiency of the company is quite high, with the 5-year average OPM at 20.5% while the industry median is only 7.9%.
Way ahead
The company expects the sales to grow further by 12% to 15% year-on-year (YoY) in FY26 and the profit to grow between 15% to 20% YoY. The operating margins are also expected to improve in FY26.
Having said that, the management raised concerns regarding the tariff impositions by the US, and they are planning to increase sales in the European markets as a hedge.
Valuation
The stock is trading at a PE of 14.4x, way lower than the industry median of 41.5x.
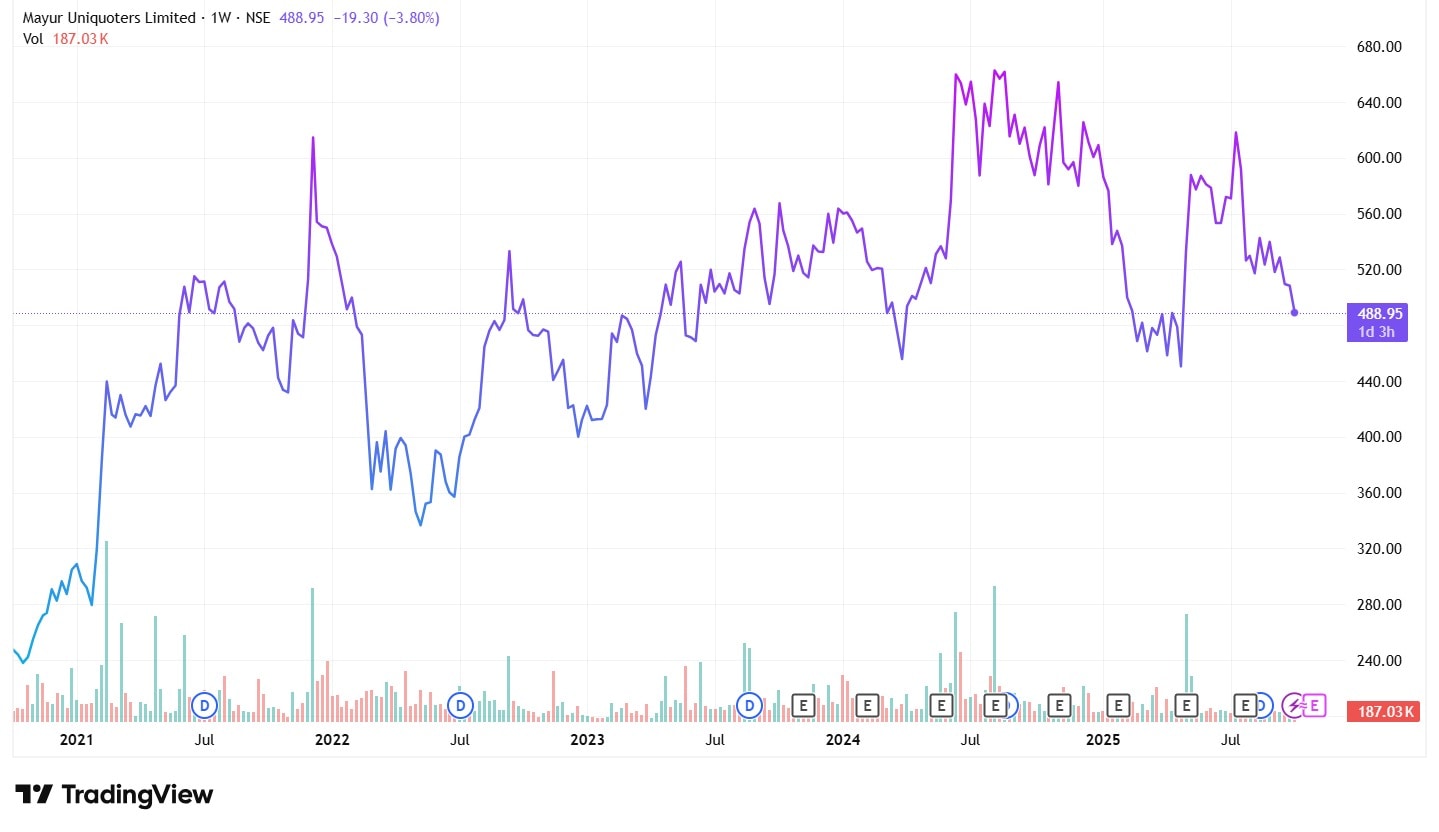
The stock price grew at a 15% CAGR in the last five years.
Mayur Uniquoters Share Price Chart (Rs)
Wrapping Up
Financial health is crucial for any business, and when investing long-term, solid financial health is one of the criteria that investors look for. And the Piotroski score is a great way to assess it. Having said that, no single formula can claim to have a perfect track record. One must always do a deep and broad study before making any financial decision.
We have relied on data from www.Screener.in throughout this article. Only in cases where the data was not available, have we used an alternate, but widely used and accepted source of information.
The purpose of this article is only to share interesting charts, data points and thought-provoking opinions. It is NOT a recommendation. If you wish to consider an investment, you are strongly advised to consult your advisor. This article is strictly for educative purposes only.
Maumita Mitra is a seasoned writer specializing in demystifying the world of investment for a broad audience. She has a keen eye for detail and a knack for explaining complex financial concepts in the simplest manner possible.
Disclosure: The writer and her dependents do not hold the stocks discussed in this article.
The website managers, its employee(s), and contributors/writers/authors of articles have or may have an outstanding buy or sell position or holding in the securities, options on securities or other related investments of issuers and/or companies discussed therein. The content of the articles and the interpretation of data are solely the personal views of the contributors/ writers/authors. Investors must make their own investment decisions based on their specific objectives, resources and only after consulting such independent advisors as may be necessary.