

From a fundamental perspective, fears of a slowdown in global trade due to possible US tariff hikes, especially on Asian exports, have led to cautious positioning by foreign institutional investors. Export-heavy sectors such as information technology and Pharma saw muted inflows. On the other hand, domestic-focused sectors like FMCG and select financials remained relatively resilient.
Technically, Nifty 50 broke below its 20 and 50-day moving averages and is currently testing support near the 24,800–24,900 zone. RSI has slipped below 50, indicating weakening momentum.
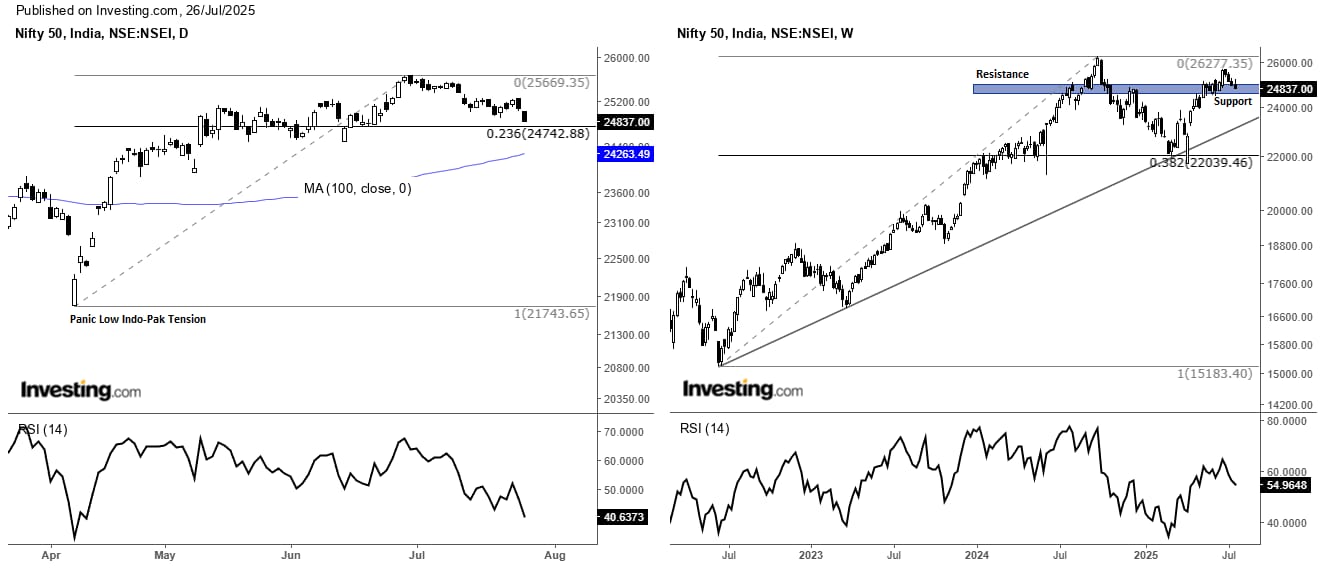
Classical Technical: Nifty is taking support from the previous resistance and the recent breakout level
Observations
Weekly chart (Right side)
Current Bull Run, which began post-COVID in July 2022, saw a sharp rally from a low of 15,180 in July 2022 to a high of 26,277 in September 2024, delivering a 73% return.
Despite recent uncertainties, such as the US tariff news & Indo-Pak tensions, Nifty has maintained its upward trajectory, staying above its traditional rising trendline on a closing basis. The price has also found support at the 38.2% Fibonacci retracement level of the post-COVID rally.
The RSI on the weekly chart is above the 50 level, indicating that underlying strength remains intact.
Daily chart (Left side) following the all-time high, Nifty made a panic low of 21,740 in April 2025 due to the US tariff news. However, the market quickly rebounded, initiating a fresh rally from this level to a recent high of 25,670 by June 2025.
The daily chart shows that Nifty has been consolidating in a range between 24,800 and 24,500. It is now testing the lower borders of this consolidation zone and near the 38.2% Fibonacci support at 24,700, suggesting that the market may find a floor here.
Classical Technical: Nifty Intraday vs RSI
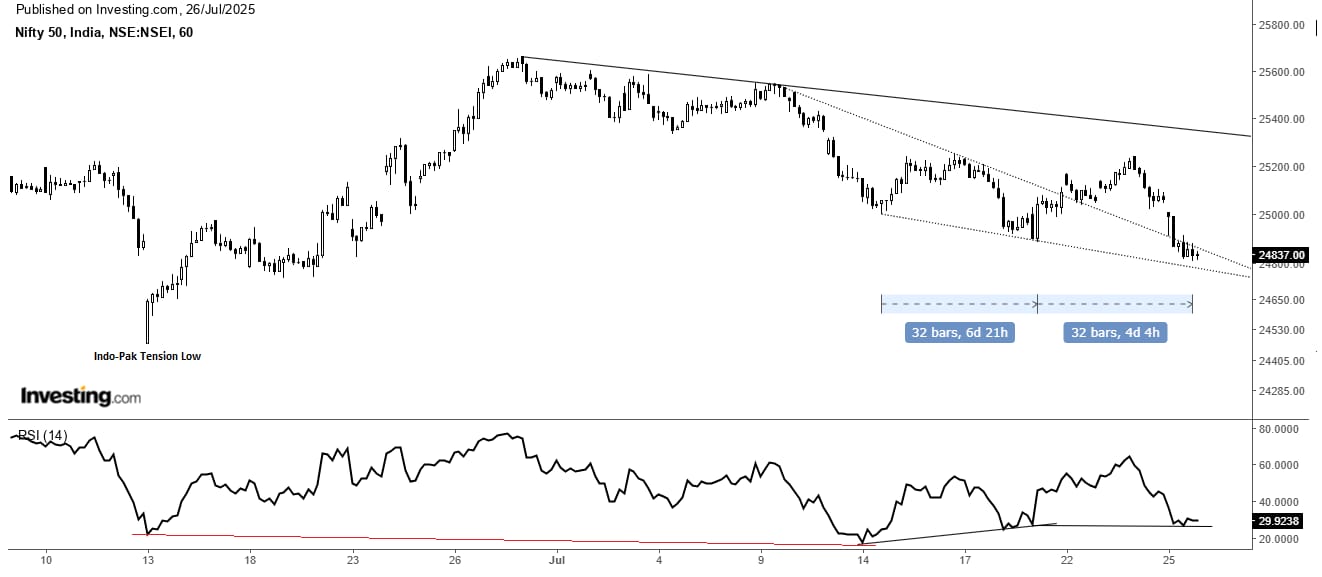
Outlook for Nifty hourly chart
Post the Indo-Pak tension, Nifty rebounded sharply & gained nearly 4.90% in just one month. Currently, the price is retracing & approaching key support near 24,800. On the hourly chart, a falling wedge bullish pattern has formed, which typically signals a potential reversal. The breakout from this wedge was short-lived, but the price is now testing an important trendline.
With this important support, one of the most powerful bullish signals is the 3-bar positive divergence seen on the 14-period RSI. During this correction, Nifty has made consecutive lower lows, but the RSI has consistently made higher lows. This classic divergence rarely forms and suggests that the market could reverse soon, with the potential for a fresh higher-high, higher-low pattern to emerge.
Final Take
When we combine the weekly, daily, and intraday charts, there are several clear bullish reversal signals indicating that the market could be on the verge of a fresh bull run. These include: support at the long-term trendline, reversal at the 38.2% Fibonacci retracement levels, a breakout from a consolidation range and most importantly, the rare 3-bar bullish divergence in RSI.
Given these factors, traders & investors should consider that Nifty may soon reverse its downtrend & head toward 26,000, potentially as early as Diwali 2025. It would be prudent to monitor these levels closely for further confirmation of this bullish setup.
Disclaimer
Note: The purpose of this article is only to share interesting charts, data points and thought-provoking opinions. It is NOT a recommendation. If you wish to consider an investment, you are strongly advised to consult your advisor. This article is strictly for educative purposes only.
As per SEBI guidelines, the writer and his dependents may or may not hold the stocks/commodities/cryptos/any other assets discussed here. However, clients of Jainam Broking Limited may or may not own these securities.
Kiran Jani has over 15 years of experience as a trader and technical analyst in India’s financial markets. He is a well-known face on the business channels as Market Experts and has worked with Asit C Mehta, Kotak Commodities, and Axis Securities. Presently, he is Head of the Technical and Derivative Research Desk at Jainam Broking Limited.
Disclosure: The writer and his dependents do not hold the stocks discussed here. However, clients of Jainam Broking Limited may or may not own these securities.
The website managers, its employee(s), and contributors/writers/authors of articles have or may have an outstanding buy or sell position or holding in the securities, options on securities or other related investments of issuers and/or companies discussed therein. The content of the articles and the interpretation of data are solely the personal views of the contributors/ writers/authors. Investors must make their own investment decisions based on their specific objectives and resources, and only after consulting such independent advisors if necessary.