
In this series of market insights, we have already covered how market intermediaries can act like toll booths, why exchanges like BSE, MCX and IEX behave like compounding machines and brokerage stocks that grew 30%+ in 5 years. This is the fourth piece in that series.
The mutual fund industry has seen a steady expansion in assets and investor participation over recent years. SIP inflows have remained strong, even through periods of market volatility. This has supported long-term AUM growth for several asset management companies (AMCs). However, the financial performance of AMCs continues to vary across businesses and across time periods.
In such an environment, investors are looking more closely at the core fundamentals of AMC stocks. The focus is not only on size, AUM scale or brand strength. Instead, the assessment is based on measurable indicators such as quarterly profit growth, stability in revenues, return on capital employed (ROCE) and dividend payouts. These metrics help capture how efficiently an AMC converts AUM into earnings and cash flows.
For this list, the selection has been made using Screener.in data and simple quantitative filters. Each company was evaluated on four core parameters — quarterly profit growth, quarterly sales growth , ROCE and dividend yield. A cut-off score of three out of five was applied. Only companies that crossed this threshold across the selected indicators were included.
The objective is to highlight AMC businesses that demonstrate consistency, capital efficiency and earnings resilience, rather than those that are merely large or well known. The shortlisted companies reflect stronger financial performance on these parameters, based on the latest available numbers, and therefore score better from a fundamentals-driven perspective. ICICI Prudential AMC has not been included in this list, as it was listed recently and comparable historical data across these parameters is still limited.
#1 The market leader: HDFC AMC
Incorporated in 1999, HDFC Asset Management Company (AMC) is one of India’s top asset managers. It offers a wide range of products catering to a range of needs.
HDFC Asset Management Company said its business continued to see steady momentum in the September quarter. The management spoke about ongoing expansion across distribution and digital platforms, along with a broader product pipeline.
The company ended the quarter with assets under management (AUM) of Rs 8.7 lakh crore. Out of this, around Rs 5.4 lakh crore was in equity-focused funds. The share of equity in the overall portfolio also went up to 64.9% on an average-quarter basis, showing that more money is gradually moving towards equity schemes, which generally earn higher fees.
The firm also said it has been increasing its presence in B-30 locations (cities and towns beyond the top 30 major financial hubs) through new office additions and higher SIP contribution from smaller towns, while digital and distribution channels saw broader participation. The company is also strengthening its alternative investment and international offerings, including activity at its GIFT City unit.
Revenue from operations for the quarter was Rs 1,026 crore, higher by 16% from a year earlier tracking the increase in equity AUM and higher systematic flows. Profit after tax stood at Rs 717.9 crore, which included a one-time tax provision reversal. Without this impact, PAT would have been Rs 671.1 crore.
Over the past five years, the company’s operating income and net profit have both grown at about 14% a year. Its average return on equity during this period is around 29%, which indicates that it has used its capital efficiently through different market phases.
Looking ahead, analysts are likely to focus on a few things — whether equity inflows remain steady, how well the company manages costs as newer businesses expand, and whether a part of the recent growth is already reflected in the current valuation of the stock.
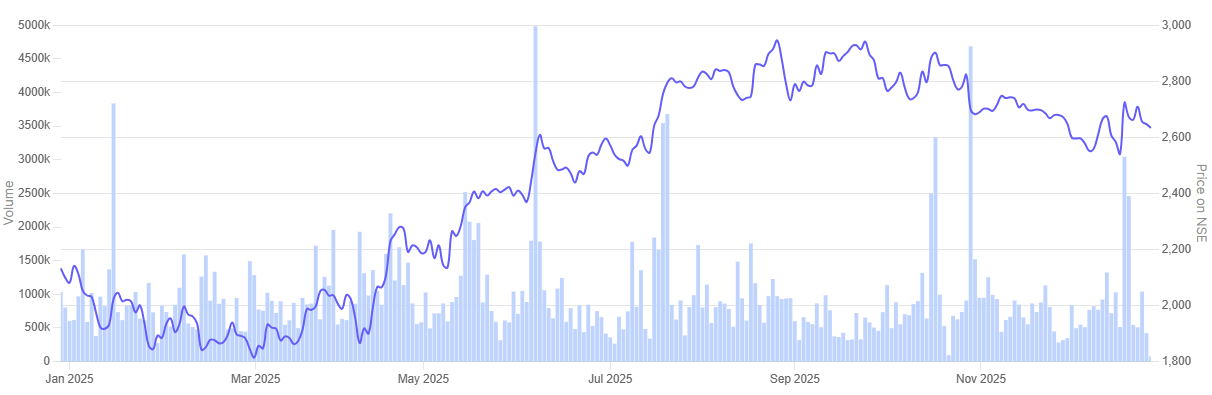
In the past year, HDFC Asset Management Company rallied 24%.
HDFC Asset Management Company 1 Year Share Price Chart
#2 The ETF giant: Nippon Life India
Nippon Life India Asset Management is engaged in managing mutual funds including exchange traded funds (ETFs); managed accounts, including portfolio management services, alternative investment funds and pension funds; and offshore funds and advisory mandates.
Nippon Life India Asset Management reported a steady operating performance in the September quarter. The management said growth was driven by higher equity assets, strong SIP participation and traction in its ETF business.
The company ended the quarter with assets under management of about Rs 7.61 lakh crore. Its mutual fund QAAUM rose 19.5% compared to last year and 7.1% over the previous quarter to Rs 6.5 lakh crore. This makes it one of the faster-growing large AMCs in the top-10 pack during the first half of FY26.
The management noted that gains in equity market share and net sales in the equity and hybrid categories supported business momentum through the first half of FY26. Equity market share rose to 7.1% while the share of equity AUM in total AUM stood at 47.6% in Q2 FY26, up 70 basis points on a sequential basis.
Alongside this, the firm continued to scale up its AIF, offshore and GIFT City platforms and added new products in the exchange traded fund (ETF) segment. The company’s ETF portfolio stood at about Rs 1.83 lakh crore and accounted for nearly 20% of the market. It also continued to see healthy transaction activity in its major schemes.
Revenue for the quarter was Rs 658 crore, higher by 15% from a year earlier. Profit after tax stood at Rs 345 crore and was lower on a YoY basis.
Over the last five years, the company’s operating income has grown at around 16% a year, while its net profit has grown at close to 25% a year. Its return on equity has also moved up sharply in this period, which shows that the company has been using its capital more efficiently and converting growth into higher profits.
Going forward, analysts may remain focused on two things — whether equity inflows stay steady, and if the recent rise in market share can continue to support profit growth over the medium term.
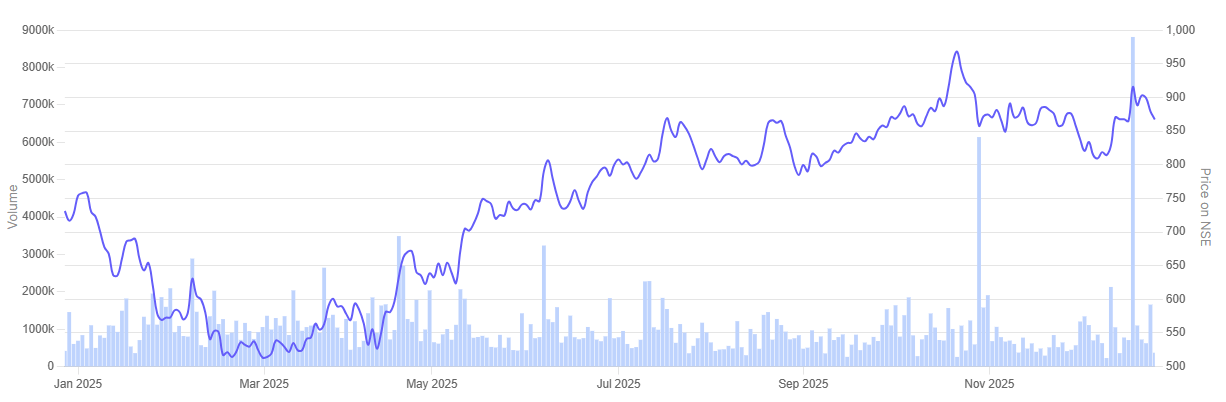
In the past year, Nippon Life India Asset Management rallied 17.4%.
Nippon Life India Asset Management 1 Year Share Price Chart
#3 The value pick: Aditya Birla sun life
Incorporated in 1994, Aditya Birla Sun Life AMC is set up as a joint venture between Aditya Birla Capital and Sun Life AMC. The company offers mutual fund services, portfolio management services, offshore and real estate offerings.
Aditya Birla Sun Life AMC reported a steady operating performance in the September quarter, with growth led by higher average assets and broader traction across its alternatives and passive platforms. The company said its overall average assets under management, including alternate assets, were at Rs 4.6 lakh crore, higher by 15% on a YoY basis. The company said the expansion was supported by flows across core mutual fund schemes as well as PMS and AIF platforms.
Mutual fund quarterly average AUM stood at Rs 4.2 lakh crore, while quarterly equity average AUM crossed the Rs 2 lakh crore mark. The management said flows were supported by SIP participation, expansion in PMS and AIF businesses, and mandates such as ESIC and EPFO debt management.
Revenue from operations for the quarter was Rs 461 crore, up 9% from a year earlier. Profit after tax came in at Rs 241 crore which is slightly lower compared to Rs 242 crore reported in Q2 FY25. The company said its offshore, GIFT City and passive initiatives continue to scale, and that it remains focused on product launches, distribution engagement and alternatives as key drivers for the medium term.
Over the last five years, the company’s operating income has grown at around 10% a year, and its net profit has grown at about 13% a year. Its return on equity is close to 29% for this period, which shows that it has been able to use its capital well.
Going forward, analysts are likely to watch how quickly the equity AUM grows and whether the company’s alternate and passive businesses can add more operating leverage and help keep earnings steadier over the medium term
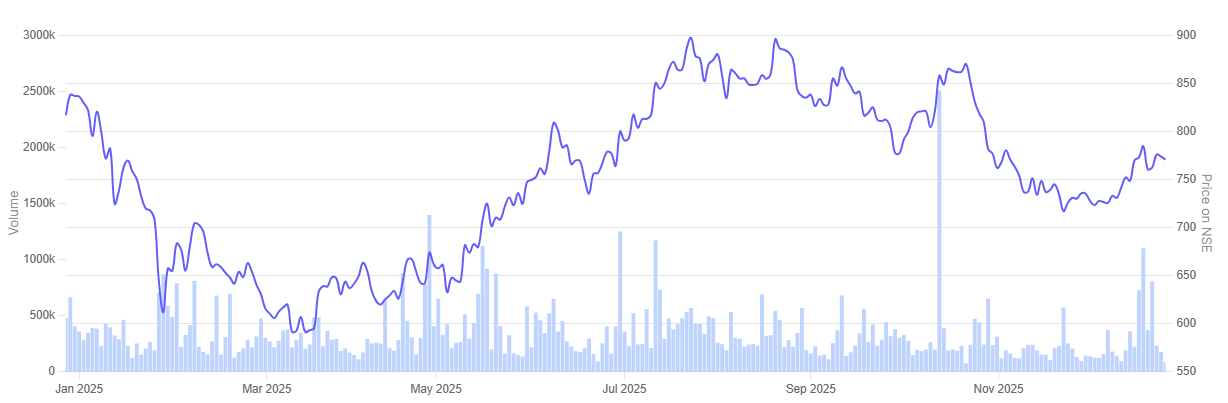
In the past year, Aditya Birla Sun Life AMC is down 4.3%.
Aditya Birla Sun Life AMC 1 Year Share Price Chart
#4 The consistent performer: Canara Robeco
Canara Robeco Asset Management Company is a joint venture between Canara Bank and Robeco, a global investment management firm. The fund house operates with a focus on disciplined investment processes and long-term portfolio management. Its product offering spans equity and hybrid schemes, with steady participation from retail and SIP investors. The business positions itself around consistency, risk-aware fund management and a research-driven investment approach.
Canara Robeco Asset Management reported a steady performance in the first half of FY26. The company said growth was supported by higher investor participation and stronger equity flows. As of September 2025, the company’s total AUM was about Rs 1.2 lakh crore, which is 6.4% higher than a year ago. Equity QAAUM made up the biggest part of the portfolio at around Rs 1.1 lakh crore. The management also pointed out that AUM from B-30 locations has increased to about Rs 28,800 crore, with healthy SIP inflows and a steady rise in the number of investor folios.
Revenue for the first half of the year was Rs 229.3 crore, 11% higher as compared to last year. Profit after tax stood at Rs 109.7 crore, 9% higher as compared to last year. Over the last few years, the company’s profit has grown quite strongly, with a three-year CAGR of about 47%. Its sales grew a 3-year CAGR of 35%, which suggests that the business is now benefiting from better scale and operating leverage. RoE also grew 35% on a 3-year CAGR basis.
Simply put, a larger part of its portfolio is in equity and its retail base has grown wider, helping the company generate steadier and more recurring cash flows.
The company said it will continue to focus on fund performance, distribution reach and product expansion. It also indicated that investments in digital channels and customer engagement would remain important areas as it looks to build growth in a gradual and disciplined manner.
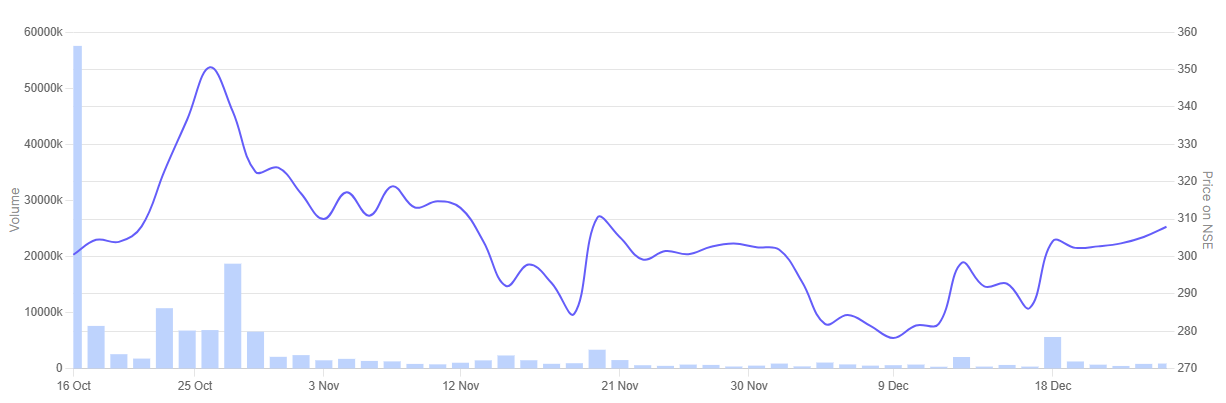
In the past year, Canara Robeco AMC is up 2.8%.
Canara Robeco Asset Management Company 1 Year Share Price Chart
Valuations
Let us now look at how these asset management companies are valued in the market. For this, we have looked at the P/E ratio and ROCE, since these numbers say a lot about profitability and efficiency in this business.
Valuations of Asset Management Companies in India
| Sr No | Company | PE | Industry Median | ROCE |
| 1 | HDFC Asset Management Company | 41.3 | 32.71 | 43.3% |
| 2 | Nippon Life Asset Management | 41.4 | 40.7% | |
| 3 | Aditya Birla Sun Life AMC | 23.6 | 35.5% | |
| 4 | Canara Robeco AMC | 32.7 | 47.7% |
HDFC AMC and Nippon Life India AMC are trading at P/E multiples of a little over 41, which is higher than the industry median of 32.7. The market seems to be giving them a premium because of their strong earnings profile and steady return ratios. Canara Robeco AMC is trading at a P/E of about 32.7. The market seems to be giving it this valuation because its return ratios are strong and the business runs efficiently.
Aditya Birla Sun Life AMC is priced lower at a P/E of 23.6. Its ROCE is still healthy, but the market appears to be taking a more careful view of its earnings outlook for now.
Overall, the higher valuations for most of these AMCs suggest that investors have reasonable confidence in their equity flows and steady cash-generating business model. But it also raises the question of how much future growth may already be priced in at current levels.
Conclusion
The mutual fund business grows with market cycles and investor confidence. Each of these companies takes a different path in the way it builds assets, manages flows and runs its business.
On the surface, AMCs look attractive because they earn steady fees, generate cash and do not need heavy capital. But many of these stocks are already trading at rich valuations. So, investors may need to see whether the future growth they expect is already built into the price.
In the end, the right stock depends on one’s risk comfort and time horizon. These companies are not recommendations, but a starting point to study the business, the numbers and how each of them behaves across different phases of the market.
Note: We have relied on data from www.Screener.in throughout this article. Only in cases where the data was not available, have we used an alternate, but widely used and accepted source of information.
The purpose of this article is only to share interesting charts, data points and thought-provoking opinions. It is NOT a recommendation. If you wish to consider an investment, you are strongly advised to consult your advisor. This article is strictly for educative purposes only.
Ekta Sonecha Desai has a passion for writing and a deep interest in the equity markets. Combined with an analytical approach, she likes to dig deep into the world of companies, studying their performance, and uncovering insights that bring value to her readers.
Disclosure: The writer and her dependents do not hold the stocks discussed in this article.
The website managers, its employee(s), and contributors/writers/authors of articles have or may have an outstanding buy or sell position or holding in the securities, options on securities or other related investments of issuers and/or companies discussed therein. The content of the articles and the interpretation of data are solely the personal views of the contributors/ writers/authors. Investors must make their own investment decisions based on their specific objectives, resources and only after consulting such independent advisors as may be necessary.