")
Joel Greenblatt is a very well-known name in the world of value investing. He is best known for The Little Book That Beats the Market. In the book, he explains a stock-picking method called the Magic Formula. The idea is simple. It looks for good companies that are still available at reasonable prices.
The formula first narrows the universe. In Greenblatt’s original method, companies below $50 million in market capitalisation i.e. the microcaps are excluded. Financials, utilities, foreign companies and ADRs are also kept out. These exclusions are used because such companies may not be comparable with normal operating businesses.
After that, the remaining companies are ranked on two factors. The first ranking is based on return on capital. This shows how efficiently a company earns profit on the capital used in the business. The second ranking is based on earnings yield. This shows whether the business is available at an attractive valuation.
The final list is made by combining both rankings. So, the formula does not simply pick the cheapest stocks. It also does not pick only the highest-return companies. It looks for stocks that score well on both quality and valuation.
Greenblatt’s method is not meant for one quick stock pick. It works as a portfolio approach. Investors are expected to buy a basket of such companies and hold them for a reasonable period, usually around one year. The portfolio is then reviewed and refreshed.
For this article, the formula has been adapted for Indian listed companies. The screen uses companies with a market capitalisation of more than Rs 5,000 crore, return on capital employed above 20%, enterprise value to EBIT (EV/EBIT) below 12 but above zero, positive profit after tax in the last financial year, and positive net profit in the latest quarter.
We have also added three-year sales growth above 10% as a safeguard against value traps. This is because some declining businesses can look cheap and still show high ROCE for some time. Moreover, only those companies that have reported Q4FY26 results have been considered.
These are the companies that made the list after applying the above-mentioned filters.
| S.No. | Company | ROCE (%) | EV/EBIT |
| 1 | Vikram Solar | 30.5 | 8.3 |
| 2 | Gokul Agro Resources | 36.7 | 10.6 |
| 3 | Sandur Manganese & Iron Ores | 24.4 | 11.7 |
| 4 | Sonata Software | 30.6 | 10.5 |
| 5 | Nazara Technologies | 27.2 | 10.9 |
| 6 | Senco Gold | 20.9 | 8.0 |
We have not included IIFL Capital Services, which made the cut, because Greenblatt’s original Magic Formula excludes financial companies. Their balance sheets work differently from normal operating businesses.
Another company that made the list was SPARC. It has also been excluded because its latest quarter numbers appear distorted by an exceptional gain. This can make ROCE and EV/EBIT look attractive for a short period but may not reflect the normal earning power of the business.
In this article, we look at Nazara Technologies, Senco Gold and Sonata Software. These companies pass the screen and also offer clearer listed-market history than very recent IPO names like Vikram Solar.
#1 Sonata Software: Transitioning to an AI-Led Order Book Amid IT Sector Compression
Sonata Software is primarily engaged in the business of providing information technology (IT) services and solutions to its various customers in the United States of America, Europe, Middle East, Australia and India.
The Revenue Divergence: AI-Led Order Books Buffer Global Margin Pressures
Sonata Software closed FY26 with a mixed but resilient quarter. Consolidated revenue for Q4 FY26 stood at Rs 2,536.2 crore. This was down 3.1% year-on-year (YoY). Net profit rose 21.4% YoY to Rs 130.5 crore. For FY26, revenue stood at Rs 10,701.2 crore, up 5.4%. Net profit increased to Rs 464.4 crore, up 9.3% YoY.
The company’s international services business showed better margin delivery despite weak growth. Dollar revenue for FY26 declined 2.1% YoY. Rupee revenue rose 4.2% to Rs 2,948 crore. PAT in this segment grew 18.7% to Rs 292.7 crore. Management said improvement came from higher utilisation, offshore mix, delivery efficiency, cost optimisation and AI-led productivity gains.
Artificial Intelligence remained the main operating theme for Sonata in the quarter. The company reported an AI-led order book of US $16.9 million in Q4 FY26 and $49 million for the full year. AI-led deals now contribute around 18% of the overall order book. The AI-led pipeline stood at $ 280 million. Management said it is pursuing AI opportunities across more than 100 clients, with focus on operational efficiency, faster time-to-market and business model transformation.
The company also won two large deals in Q4 FY26. For the full year, it won eight large deals. One of the key wins was with a global fintech company, where Sonata will work on core banking platform modernisation and AI-led implementation. The company also added seven new customers in Q4 and 23 new customers during FY26. Healthcare and life sciences, along with banking, financial services, and insurance (BFSI) now contribute 30% of total revenue.
The domestic business remained steady but faced pressure from one large client moving to a direct relationship with Microsoft. Q4 FY26 domestic revenue stood at Rs 1,759.2 crore, up 8.3% YoY. PAT rose 2.5% YoY to Rs 46.3 crore. Management said the business is expanding coverage in small and medium corporate (SMC) and corporate segments, deepening hyperscaler partnerships and building cloud-led managed services capabilities.
The Valuation Gap: Decoupling Structural Return Metrics From a 33% Market Correction
From a Greenblatt Magic Formula lens, Sonata fits the quality-and-valuation screen because of its high return ratios and moderate enterprise valuation. The stock has a return on capital employed (ROCE) of 30.6% and return on equity (ROE) of 28.2%. It trades at EV/EBITDA of 9.2 times, compared with its three-year EV/EBITDA of 19.3 times. The valuation appears lower than its own recent average, while return metrics remain strong.
The near-term picture is still not without risks. Management said macro uncertainty and longer client decision cycles continue to weigh on growth. Some verticals, including BFSI and retail, have seen client-specific pressures. Still, the company enters FY27 with a healthier AI pipeline, better margins and signs of stabilisation in key accounts. The next test will be whether Sonata can convert AI-led demand into sustained revenue growth, not just margin improvement.
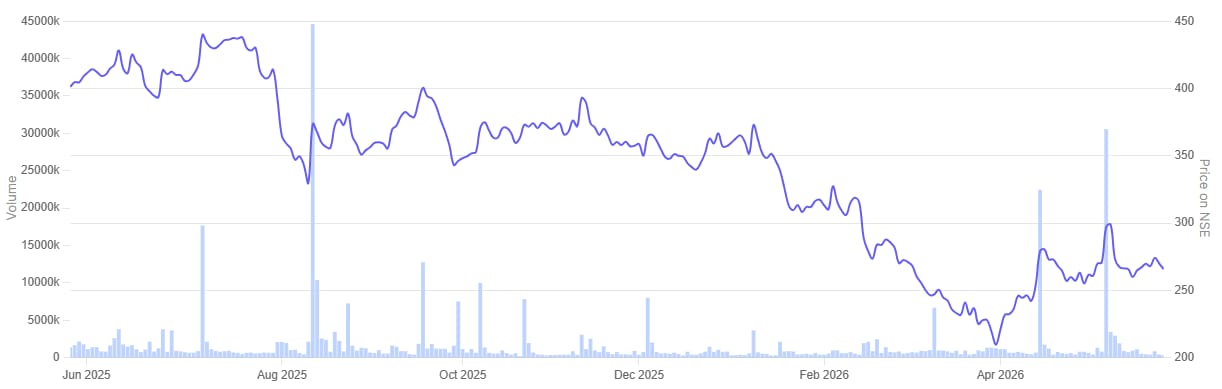
In the past year, the share price of Sonata Software tumbled 33.7%.
Sonata Software 1 Year Share Price Chart
#2 Nazara Technologies: Structural Shift to High-Margin Gaming Offsets Adtech Softness
Nazara Technologies is the leading India based diversified gaming and sports media platform with presence in India and across emerging and developed global markets such as Africa and North America, and offerings across the interactive gaming, e-sports and gamified early learning ecosystems.
Nazara Technologies ended FY26 with a larger gaming-led earnings base. The company reported FY26 revenue of Rs 1,829 crore, up 13% YoY. Net profit rose 60.8% to Rs 82 crore. In Q4 FY26, revenue stood at about Rs 398 crore lower from Rs 520 crore reported a year ago. Net profit for the quarter stood at Rs 55.7 crore, up 196.1% YoY, based on the screened financial data.
Structural Re-rating: Gaming Core Expands to Command 90% of EBITDA
The key shift was in the business mix. Gaming’s contribution to earnings before interest, tax, depreciation, and amortisation (EBITDA) increased from 56% in FY25 to 90% in FY26. The gaming business reported FY26 revenue of Rs 1,072 crore, up 107% YoY. Its EBITDA rose 157% to Rs 265 crore. This shows that Nazara is moving more clearly towards a higher-margin gaming platform.
The company’s largest recent move was the acquisition of Bluetile and BestPlay. The acquisition expands Nazara’s casual gaming scale and adds AI-native game development capabilities. Management said the acquisition is expected to be consolidated from Q1 FY27, subject to pending Spanish FDI approval.
Nazara is also building growth through existing intellectual properties. Kiddopia returned to subscriber growth. Animal Jam improved margins and is expanding through IP integrations. Fusebox is working on more reality-TV-led games, including Big Brother, Bigg Boss and Traitors. Curve Games also plans new releases in FY27, with titles such as Dragon Shelter and Sovereign Tower.
The company is using its Centers of Excellence across user acquisition, data analytics, AI, growth and product. Management said these systems are now being applied across owned and acquired gaming assets. The focus is to improve monetisation, reduce volatility and scale games across mobile, PC, console and offline formats.
Valuation Arbitrage: Spotting the Disconnect in Nazara’s Historic EV/EBITDA Compression
From a Greenblatt Magic Formula lens, Nazara fits the quality-and-valuation screen. The stock has ROCE of 27.2% and ROE of 30.5%. It trades at EV/EBITDA of 8.8 times, compared with its three-year EV/EBITDA of 37 times. This gives it a quality-at-reasonable-valuation profile.
The risks are still visible. Q4 sales were down 23.5% year-on-year as per the screened data. Sportskeeda remained under pressure after Google Core updates. The adtech business also saw some softness as the company shifted focus towards product-led and tech-driven growth. Nazara’s next phase will depend on how well it converts acquisitions, AI tools and gaming IPs into sustained revenue growth.
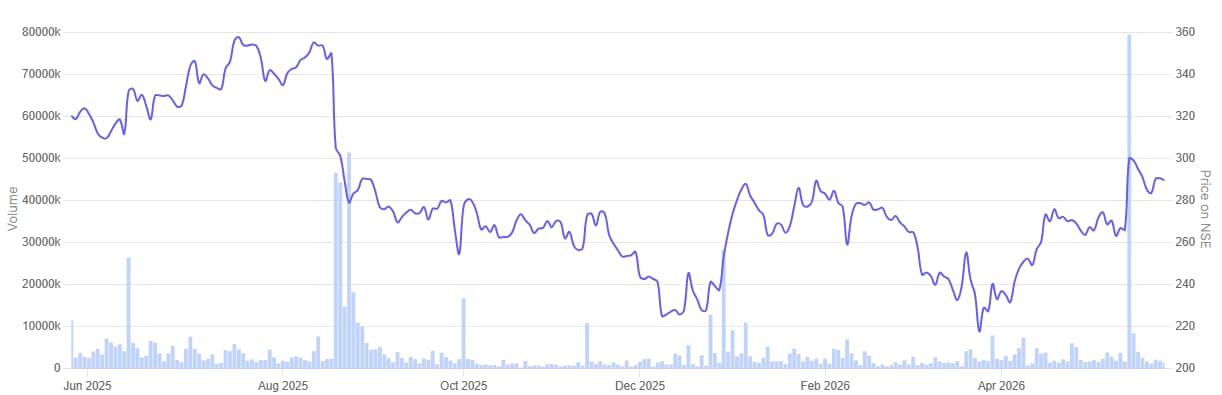
In the past year, the share price of Nazara Technologies is down 9.4%.
Nazara Technologies 1 Year Share Price Chart
#3 Senco Gold: Navigating Headwinds in Volume via Asset-Light Franchise Expansion
Incorporated in 1994, Senco Gold is a Pan-India jewellery retailer and is the largest organized jewellery retail player in the eastern region of India based on the number of stores.
Revenue vs Volume: Decoding Senco’s Growth Engines Amid Severe Gold Price Spikes
Senco Gold ended FY26 with strong growth, helped by a full wedding quarter and high gold prices. In Q4 FY26, revenue rose around 45% YoY to Rs 1,997 crore. PAT rose 151% to Rs 157 crore. For FY26, revenue stood at Rs 8,430 crore, up 33% YoY, while PAT rose 261% to Rs 574 crore.
The quarter was supported by resilient jewellery demand despite sharp gold price volatility. Domestic average gold prices were up 79% YoY and 20% quarter-on-quarter. This affected gold volumes, but demand stayed strong in value terms. The company also saw a shift towards lightweight and lower-carat jewellery. Its 9K and 14K portfolio helped attract younger buyers.
Old gold exchange remained a key growth driver. It contributed around 50% of Q4 revenue and 44% of FY26 revenue. This helped customers upgrade jewellery even when gold prices were elevated. Diamond demand also held up, with diamond volumes rising 9% and value growing 32% during the year.
Senco continued to expand its store network. The company ended FY26 with 201 showrooms, including 102 company-owned stores, 85 franchise stores, 12 Sennes stores and two stores in Dubai. It opened 26 showrooms during FY26 and seven showrooms in Q4. The company also entered new geographies such as Rajasthan, central Maharashtra and western Uttar Pradesh.
Capital Allocation Strategy: Mitigating Working Capital and Inventory Drag via Franchise Scale
The company is also leaning on its asset-light franchise model. Franchise stores contributed about 35% of revenue. Senco plans to use this model to expand into Tier-III and Tier-IV towns under its broader Bharat strategy. It also wants to grow higher-margin products through Sennes, Everlite and Gossip.
From a Greenblatt Magic Formula lens, Senco fits the quality-and-valuation screen. The stock has ROCE of 20.9% and ROE of 25.6%. It trades at EV/EBITDA of 7.4 times, compared with its one-year EV/EBITDA of 13.2 times. This gives it a reasonable valuation profile, while return ratios remain healthy.
The outlook is still linked to gold prices and working capital discipline. Inventory rose sharply during FY26, partly due to higher gold prices and new showroom additions. Management has guided for over 20% value growth in FY27 and EBITDA margin of 7.5% to 7.7%. The next test will be whether Senco can sustain growth while improving inventory days and keeping borrowing costs under control.
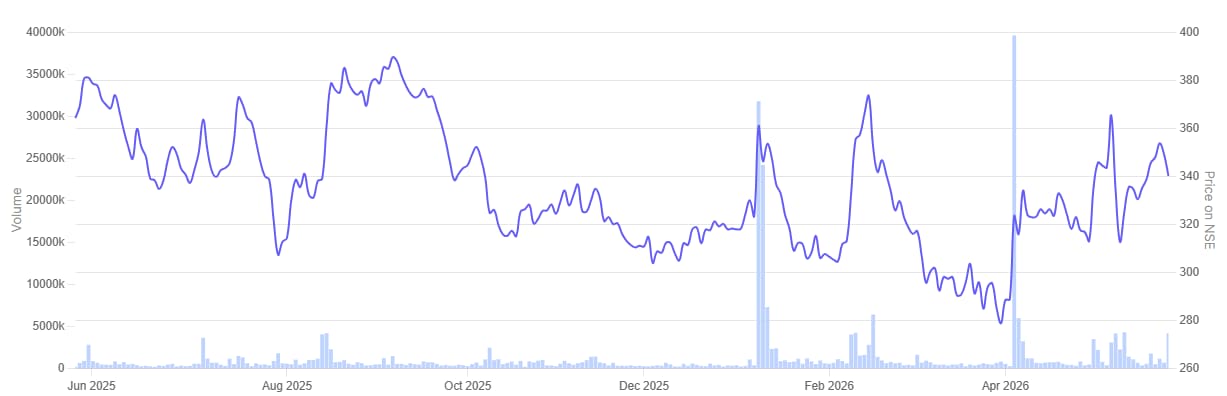
In the past year, the share price of Senco Gold is down 9.4%.
Senco Gold 1 Year Share Price Chart
Conclusion
The Magic Formula does not remove risk. It only gives investors a more disciplined starting point. The idea is to look at two things together. The business should earn healthy returns on capital. The stock should also be available at a reasonable enterprise valuation.
That is why the final call cannot be based on the screen alone. Investors still need to check whether the earnings are repeatable, whether growth is holding up, and whether the company is not a value trap.
At a time when many quality stocks are expensive, this approach can help narrow the field. It points investors towards companies where both business strength and valuation deserve a closer look.
You can track how these are progressing by adding stocks to your watchlist.
Disclaimer:
Note: We have relied on data from www.Screener.in throughout this article. Only in cases where the data was not available, have we used an alternate, but widely used and accepted source of information.
The purpose of this article is only to share interesting charts, data points and thought-provoking opinions. It is NOT a recommendation. If you wish to consider an investment, you are strongly advised to consult your advisor. This article is strictly for educative purposes only.
Ekta Sonecha Desai has a passion for writing and a deep interest in the equity markets. Combined with an analytical approach, she likes to deep dive into the world of companies, studying their performance, and uncovering insights that bring value to her readers.
Disclosure: The writer and her dependents do not hold the stocks discussed in this article.
The website managers, its employee(s), and contributors/writers/authors of articles have or may have an outstanding buy or sell position or holding in the securities, options on securities or other related investments of issuers and/or companies discussed therein. The content of the articles and the interpretation of data are solely the personal views of the contributors/ writers/authors. Investors must make their own investment decisions based on their specific objectives, resources and only after consulting such independent advisors as may be necessary.