

As quarterly earnings for HDFC Bank and ICICI Bank were released, the stocks were among the top gainers today. Last weekend, HDFC Bank and ICICI Bank released their quarterly results, triggering excitement in the markets on the Monday with gains of 2.20% and 2.81% respectively.
Are these stocks still worth trading or investing in after the results?
Let’s analyse using technical analysis to assess potential trends and trading opportunities.
ICICI Bank
ICICI Bank Weekly Chart
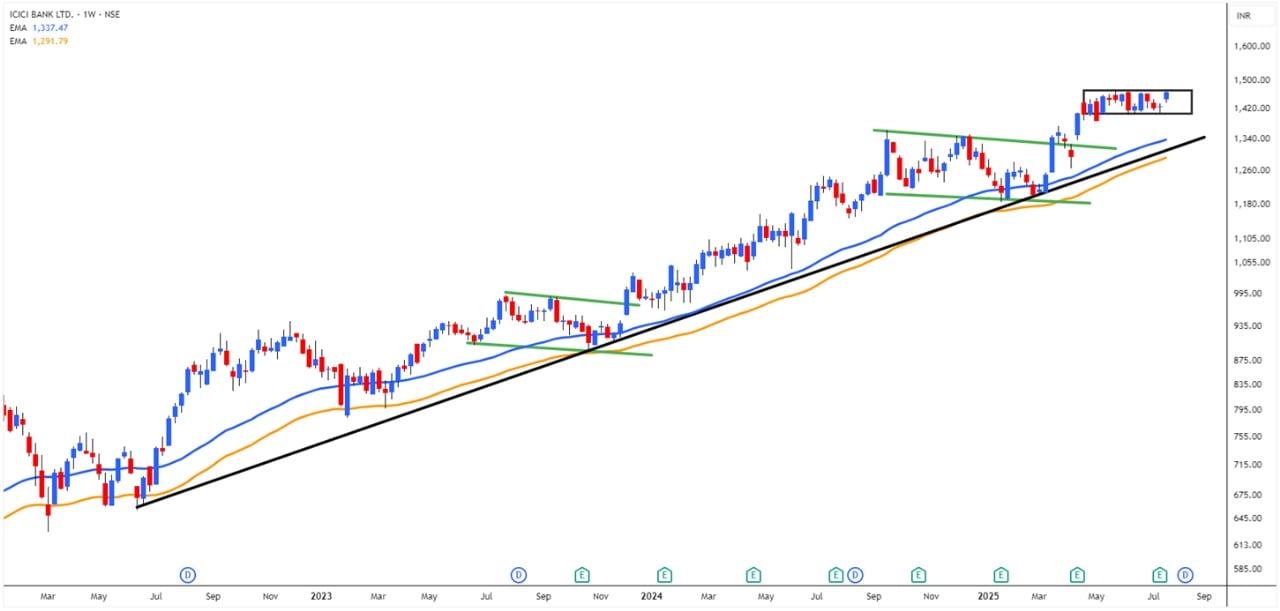
On the weekly chart, the stock is maintaining a Higher High – Higher Low structure, indicating a bullish trend in line with Dow Theory. Considering the chart pattern, the series of multiple bullish breakout patterns confirms the potential strength of the ongoing uptrend.
Currently, the stock is moving within a rectangle pattern with a bullish bias, suggesting a potential breakout which will resume the potential bullish trend. A rising trendline (black) has been well respected by the bulls who are grabbing the opportunity at each support level.
Adding strength to this bullish case is the 50-Week Exponential Moving Average (50WEMA) Channel plotted using the high and low of the 50WEMA. The 50WEMA zone has been an accumulation zone for traders. A break below this channel and the rising trendline would signal a potential shift in trend. Until then, the bulls appear to be maintaining control of the trend.
HDFC Bank
HDFC Bank Weekly Chart
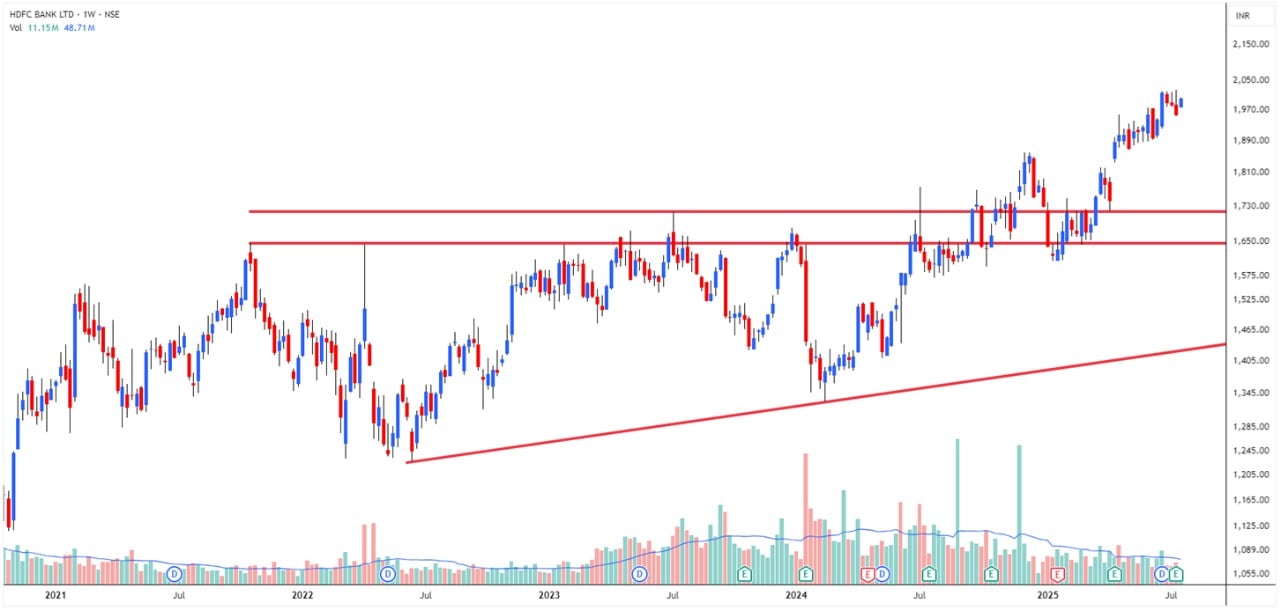
The stock has been trending bullish and recently hit a new all-time high of Rs 2,022, just before the quarterly results. On the chart, the Higher High – Higher Low confirms a structurally bullish uptrend.
In 2024, the stock broke out of an Ascending Triangle pattern, a bullish continuation pattern. Following the breakout, the price pulled back to retest the breakout zone, a move considered a sign of strength and opportunity in technical analysis, as it often provides a second entry opportunity for traders and confirms the breakout’s validity.
The successful retest was followed by renewed bullish momentum, showing that the bulls used the dip to re-enter. The ongoing trend indicates that HDFC Bank’s bullish momentum is likely to sustain through the remainder of 2025, provided broader market conditions remain supportive.
Disclaimer
Note: The purpose of this article is only to share interesting charts, data points and thought-provoking opinions. It is NOT a recommendation. If you wish to consider an investment, you are strongly advised to consult your advisor. This article is strictly for educative purposes only.
As per SEBI guidelines, the writer and his dependents may or may not hold the stocks/commodities/cryptos/any other assets discussed here. However, clients of Jainam Broking Limited may or may not own these securities.
Kiran Jani has over 15 years of experience as a trader and technical analyst in India’s financial markets. He is a well-known face on the business channels as Market Experts and has worked with Asit C Mehta, Kotak Commodities, and Axis Securities. Presently, he is Head of the Technical and Derivative Research Desk at Jainam Broking Limited.
Disclosure: The writer and his dependents do not hold the stocks discussed here. However, clients of Jainam Broking Limited may or may not own these securities.
The website managers, its employee(s), and contributors/writers/authors of articles have or may have an outstanding buy or sell position or holding in the securities, options on securities or other related investments of issuers and/or companies discussed therein. The content of the articles and the interpretation of data are solely the personal views of the contributors/ writers/authors. Investors must make their own investment decisions based on their specific objectives and resources, and only after consulting such independent advisors if necessary.