



According to the Society of Indian Automobile Manufacturers (SIAM), India produced 34.7 million vehicles in FY26. Sales reached record levels across all major vehicle categories. Passenger vehicle sales rose 7.9% to 4.64 million units. Two-wheeler sales increased 10.7% to 21.7 million units. Commercial vehicle and three-wheeler sales grew 12.6% and 12.8%, respectively.
The year began slowly, but demand improved sharply in the second half. SIAM attributed the recovery to GST reforms, income-tax relief and lower borrowing costs following repo rate cuts. Exports also remained strong. Passenger vehicle exports grew 17.5%, while two-wheeler exports increased 23.4%. However, rising input costs, crude oil prices and geopolitical tensions remain key risks for FY27.
Against this backdrop, we look at the three cheapest auto stocks based on the enterprise value-to-EBITDA, or EV/EBITDA, ratio. The ratio compares a company’s total value with its operating earnings. Unlike the price-to-earnings ratio, it considers debt and cash. This makes it useful for comparing auto companies with different capital structures.
We started with the broader list of listed auto stocks. We then filtered companies with a market capitalisation of more than Rs 500 crore. Only original equipment manufacturers, or OEMs, were considered. Dealerships were excluded. We also removed companies with a negative EV/EBITDA ratio. From the remaining list, we selected the five stocks with the lowest ratios.
#1 Tata Motors Passenger Vehicles: Does the Low Multiple Factor in JLR’s Headwinds?
Tata Motors Passenger Vehicles , formerly Tata Motors, is part of the Tata Group . Following the October 2025 demerger, its commercial vehicle business was separated and listed as Tata Motors. The company now houses the domestic passenger vehicle and EV businesses, Jaguar Land Rover and its investment in Tata Technologies.
Tata Motors Passenger Vehicles Financial Performance
| Metric | FY26 |
| Revenue growth | -8.3% YoY |
| Net profit growth | 196.0% YoY* |
| RoCE | 2.7% |
| RoE | 75.7%* |
| EV/EBITDA | 6.9x |
Source: Screener.in and FY26 company results and earnings-call transcript.
The stock trades at an EV/EBITDA ratio of 6.9x, against the peer median of 16x. Its RoCE stands at 2.7%, while RoE is 75.7%. The high RoE is distorted by the demerger-related gain and should not be viewed in isolation.
Consolidated revenue declined 8.3% year-on-year (YoY) to Rs 3,35,582 crore in FY26. Reported net profit rose 196% to Rs 82,390 crore. However, the profit included a large one-time gain arising from the demerger. Profit before tax and exceptional items was only around Rs 2,500 crore. This gives a more realistic picture of the underlying performance.
Analyzing the JLR Production Bottleneck and Currency Risks
The weakness came mainly from Jaguar Land Rover. Production was affected for two quarters by a cyber incident. The business also faced US tariffs, weak demand in China and the planned phase-out of older Jaguar models. JLR wholesales fell to 308,000 units in FY26. Its revenue declined 20.9% to £22.9 billion.
The domestic business performed better. Tata Motors Passenger Vehicles sold a record 6.42 lakh units in FY26. This was an increase of more than 15%. Its growth was nearly twice the 8% expansion recorded by the broader passenger vehicle industry. Market share crossed 14% in the second half, supported by demand for the Nexon, Punch and Sierra.
EV Fleet Dominance and Future Production Ramps
Electric vehicles remained an important growth driver. EV sales increased 43% to 92,000 units. The company retained a market share of more than 40%. CNG vehicles accounted for 27% of its domestic portfolio, with sales exceeding 1.7 lakh units.
The company plans to expand production to meet demand. Sierra output has been constrained by delays from some suppliers. Additional suppliers are being added to support the ramp-up. The company aims to cross monthly Sierra production of 10,000 units. The Sierra EV is also scheduled for launch in FY27.
JLR is preparing to launch the Range Rover Electric and Range Rover Sport Electric. It will later reveal the production version of the new Jaguar Type 01. JLR is also targeting £1.7 billion of savings over two years. The plan is aimed at lowering its annual break-even volume to around 300,000 units. Separately, JLR has licensed the Freelander brand to Chery for vehicles manufactured in China. It will earn royalty and manufacturing-related income from the venture.
The valuation discount reflects genuine concerns. These include JLR’s weak FY26 performance, tariff pressure, China exposure, high investment needs and consolidated net debt. A recovery will depend on smooth product launches, cost savings and improved JLR cash flows. Domestic growth provides support, but the global business remains the key test.
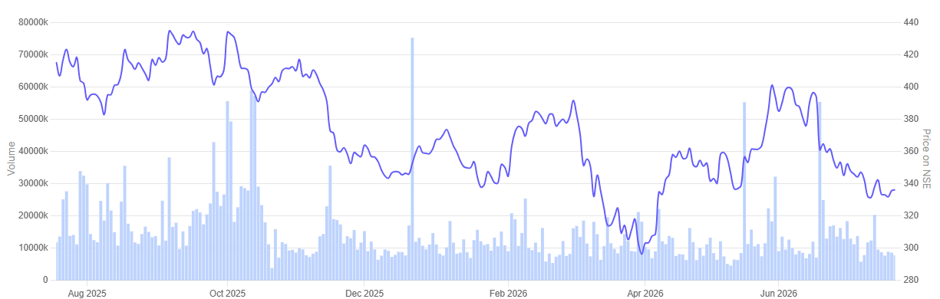
Since its listing in October 2025, the share price of Tata Motors Passenger Vehicles is down 19.2%.
Tata Motors Share Price Chart Since Listing
#2 Mahindra & Mahindra: Can Capacity Expansion Sustain the Growth?
Mahindra & Mahindra is one of India’s largest automobile and tractor manufacturers. The Mahindra Group’s operations also cover financial services, technology, logistics and real estate . The auto business includes SUVs, electric vehicles , light commercial vehicles, trucks and last-mile mobility products.
Mahindra & Mahindra Financial Performance
| Metric | FY26 |
| Revenue growth | 25.0% YoY |
| Net profit growth | 35.0% YoY |
| RoCE | 15.1% |
| RoE | 20.3% |
| EV/EBITDA | 11.8x |
The stock trades at an EV/EBITDA ratio of 11.8x. This is below the auto industry median of 16x. The company’s RoCE stands at 15.1%, while RoE is 20.3%.
M&M reported consolidated revenue of Rs 1,98,639 crore in FY26. This was an increase of 25% year-on-year. Consolidated profit after tax rose 35% to Rs 17,099 crore. However, gains from the sale of investments also supported profit growth.
The automobile business remained a key growth driver. Volumes increased 19%, while profit grew 33%. Its full-year operating margin improved by 80 basis points. M&M ended FY26 with a 25.3% share of the domestic SUV market by revenue. Its light commercial vehicle market share also rose to 52.3%.
EV Penetration and Segment Operational Profitability
Electric vehicles gained scale during the year. M&M sold around 55,000 electric SUVs following the launch of its new range. EV penetration reached 9.6% for FY26 and crossed 10% in the final two months. The electric vehicle business also became profitable at the operating level. It reported full-year PBIT of Rs 287 crore, including contract manufacturing.
Capacity remains an important constraint. Monthly internal combustion engine capacity increased from 54,000 units to 56,500 units during FY26. The company plans to raise it to 60,000 units by September or October 2026. It will also add capacity for 10,000 vehicles based on the NU_IQ platform. Another 4,000 units of EV capacity will be added for launches planned in FY28.
The proposed Nagpur plant remains on schedule for commissioning around mid-2028. The company is close to completing the land acquisition process. It expects project execution to take about two years.
M&M plans to launch 10 new internal combustion engine SUVs and six battery electric SUVs by FY31. It also plans 10 new light commercial vehicle launches over the same period. The company expects its SUV volumes to grow in the mid-to-high teens in FY27.
International operations offer both an opportunity and a risk. M&M finished FY26 as India’s fifth-largest vehicle exporter and was close to the fourth position. The company also sees export opportunities from India’s new trade agreements. In the farm business, it has exited three underperforming overseas operations. It will retain its presence in the US, Brazil and Turkey.
The valuation discount may reflect the cyclical nature of the auto and tractor businesses. Commodity inflation, supply constraints and heavy spending on new capacity are additional risks. The group’s complex structure may also result in a conglomerate discount. For now, earnings growth and improving EV profitability provide support. The next test will be executing the capacity expansion without weakening returns or margins.
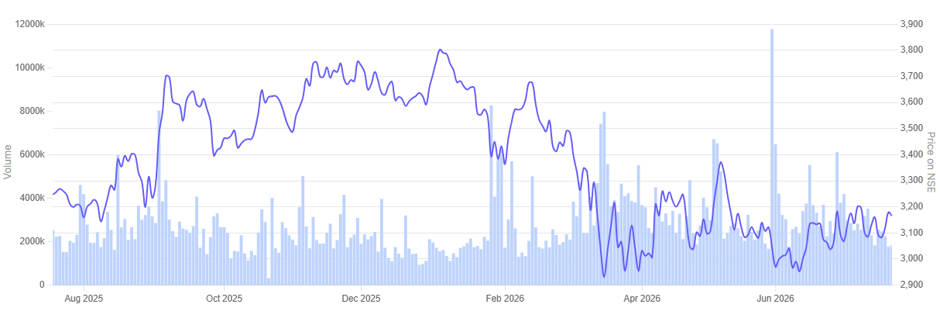
In the past year, the share price of Mahindra & Mahindra, is down 2.5%.
Mahindra & Mahindra 1 Year Share Price Chart
#3 Hero MotoCorp: Can New Growth Segments Narrow the Valuation Gap?
Hero MotoCorp , earlier also known as Hero Honda, is one of India’s first motorcycle manufacturers. The company was established in 1984 as a technological collaboration with Honda, Japan. Before this collaboration, Hero was selling cycles under the brand name, Hero Cycles.
In 2011, Honda group sold its 26% stake in the company to the Munjals (promoters) and ended the joint venture (JV) Following the termination of JV, the name of the company was changed to Hero Motocorp.
Hero MotoCorp Financial Performance
| Metric | FY26 |
| Revenue growth | 15.0% YoY |
| Net profit growth | 14.0% YoY |
| RoCE | 35.2% |
| RoE | 28.1% |
| EV/EBITDA | 11.9x |
The stock trades at an EV/EBITDA ratio of 11.9x. This is slightly below the peer median of 12.5x. Its RoCE stands at 35.2%, while RoE is 28.1%. The strong return ratios reflect the profitability and capital efficiency of its established motorcycle business.
Hero MotoCorp is the world’s largest two-wheeler manufacturer by volume. Its domestic strength comes mainly from entry-level and commuter motorcycles. The company is now expanding its presence in scooters, electric vehicles and premium motorcycles.
Hero MotoCorp reported its highest-ever revenue and profit in FY26. Revenue increased 15% YoY to Rs 46,830 crore. Net profit rose 14% to Rs 5,268 crore.
Margin Outperformance: Core ICE Leverage vs Premium Launches
The internal combustion engine business remained the main profit driver. Its EBITDA margin expanded by 90 basis points to 17%. Pricing, operating leverage and cost savings supported the improvement. After including investments in the electric vehicle business, the overall EBITDA margin stood at 14.7%.
Growth was stronger in areas where Hero has historically had a smaller presence. Scooter volumes increased 48% in the fourth quarter. Electric scooter volumes grew 2.5 times. Sales of its Harley-Davidson range rose 26%. The company launched nine products during FY26 to fill gaps across these categories.
Hero plans to spend more than Rs 1,500 crore in FY27. Part of this will be used to expand scooter and electric vehicle capacity. Destini production capacity has already increased by 50%. Xoom capacity is expected to double during the first quarter of FY27.
VIDA Capacity Scaling and the Cost of EV Aggression
The company is also expanding VIDA capacity. It plans to increase monthly EV capacity from 15,000 units to 25,000 units shortly. Capacity is expected to double again by the end of FY27. However, the EV business remains in an investment phase. It reduced quarterly EBITDA by around Rs 220 crore in the fourth quarter.
Hero will invest over Rs 700 crore in a second global parts centre in southern India. The facility will nearly double its parts-handling capacity. The company currently estimates that it serves only around half of the replacement-parts demand generated by its vehicles.
Global operations are another focus area. Overseas dispatches grew 41% in FY26 after rising 40% in the previous year. Hero is present in 52 countries. It plans to expand further in Latin America and Africa. New launches are also planned in Bangladesh, where it currently serves only about half the market. The company has also re-entered Sri Lanka.
The modest valuation discount may reflect Hero’s dependence on commuter motorcycles. These categories face intense competition and are sensitive to rural demand. Hero is also underrepresented in faster-growing scooters, premium motorcycles and EVs. EV losses, rising commodity costs and higher capital spending add to the risk.
Hero’s core business remains profitable and cash-generative. However, a sustained re-rating will depend on whether capacity expansion leads to market-share gains. The company must also improve EV profitability without weakening its overall margins.
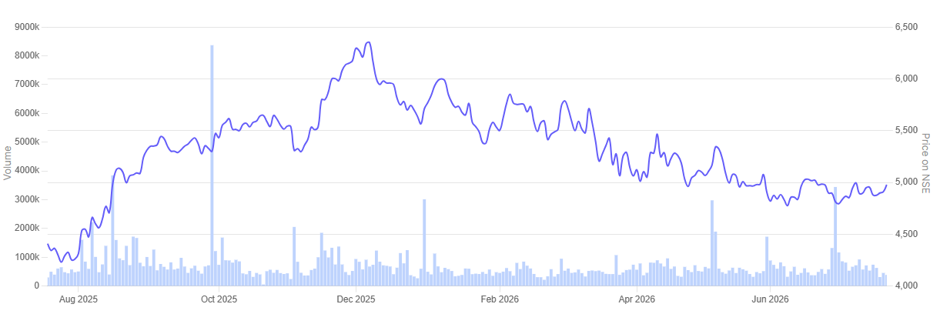
In the past year, the share price of Hero MotoCorp is up 13%.
Hero MotoCorp 1 Year Share Price Chart
Conclusion
For now, the valuation gap reflects different concerns across these companies. Some are dealing with weak overseas operations. Others are spending heavily on new capacity, electric vehicles and product launches. A lower EV/EBITDA ratio may therefore indicate uncertainty rather than a clear bargain.
The next phase will depend on execution. Domestic demand remains supportive, but margins face pressure from commodity costs and rising competition. EV profitability, capacity utilisation and global recovery will be key. Investors should also track cash flow and RoCE. EBITDA growth will matter only if it translates into stronger returns and sustainable cash generation.
India’s Cheapest Auto Stocks
| Metric | Tata Motors Passenger Vehicles | Mahindra & Mahindra | Hero MotoCorp |
| EV/EBITDA | 6.9x | 11.8x | 11.9x |
| FY26 revenue growth | -8.3% | 25.0% | 15.0% |
| FY26 net profit growth | 196.0%* | 35.0% | 14.0% |
| RoCE | 2.7% | 15.1% | 35.2% |
| RoE | 75.7%* | 20.3% | 28.1% |
Source: Screener.in and FY26 company results and earnings-call transcripts.
You can track how these are progressing by adding stocks to your watchlist.
Note: We have relied on data from www.Screener.in throughout this article. Only in cases where the data was not available, have we used an alternate, but widely used and accepted source of information.
The purpose of this article is only to share interesting charts, data points and thought-provoking opinions. It is NOT a recommendation. If you wish to consider an investment, you are strongly advised to consult your advisor. This article is strictly for educative purposes only.
Ekta Sonecha Desai has a passion for writing and a deep interest in the equity markets. Combined with an analytical approach, she likes to deep dive into the world of companies, studying their performance, and uncovering insights that bring value to her readers.
Disclosure: The writer and her dependents do not hold the stocks discussed in this article.
The website managers, its employee(s), and contributors/writers/authors of articles have or may have an outstanding buy or sell position or holding in the securities, options on securities or other related investments of issuers and/or companies discussed therein. The content of the articles and the interpretation of data are solely the personal views of the contributors/ writers/authors. Investors must make their own investment decisions based on their specific objectives, resources and only after consulting such independent advisors as may be necessary.