




Finding good stocks under Rs 100 is becoming more and more difficult. Many cheap stocks are cheap for a reason while only a handful quietly build strong technical structures before making a meaningful move. That’s why price should never be the only consideration. Instead, smart investors look for stocks where price action, volume and chart patterns suggest institutional money may be returning.
Five stocks that are trading below Rs 100 have grabbed the attention this week due to interesting technical setups. These are stocks across various sectors, but they have one thing in common – they are showing bullish chart formations and traders are looking at them for potential upside.
1. Wyckoff Accumulation Signals Strength for HCC Ltd.
Hindustan Construction Company (HCC) looks like it is completing a classic Wyckoff Accumulation structure on weekly chart.
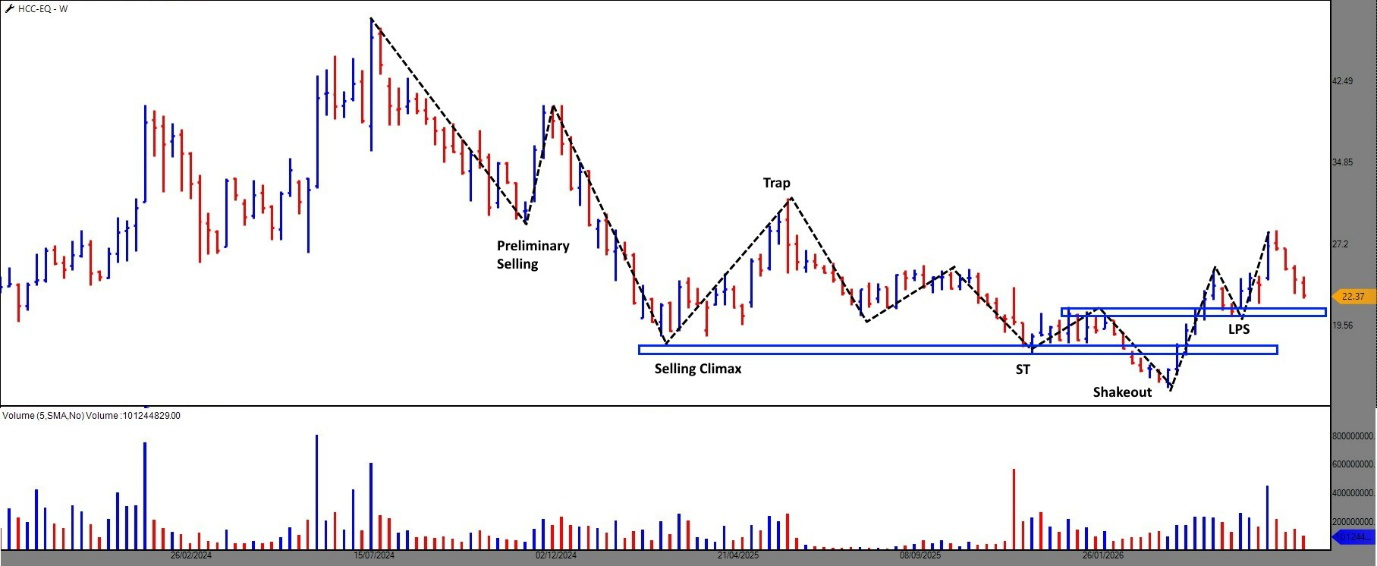
After extended selling pressure, the stock made a Selling Climax (SC) followed by a Secondary Test (ST).
A Shakeout where the weak hands were shaken out before heavy buying came in, confirming the potential bottom of the current fall. The stock then created a Last Point of Support (LPS) and has subsequently moved higher to confirm renewed buying interest.
The whole sequence is one of the most respected accumulation patterns in technical analysis because it often reveals the participation of institutions before a sustained uptrend begins.
The stock has seen some profit booking post its recent rally but continues to trade above its important support zone of LPS.
HCC is worth keeping on the watchlist for investors as long as it continues to respect its accumulation zone of Rs.19-22.
2. Lloyd’s Engineering Works – Breakout of Megaphone with High Volume
Lloyds Engineering has made a significant breakout from a Megaphone Pattern or broadening formation.
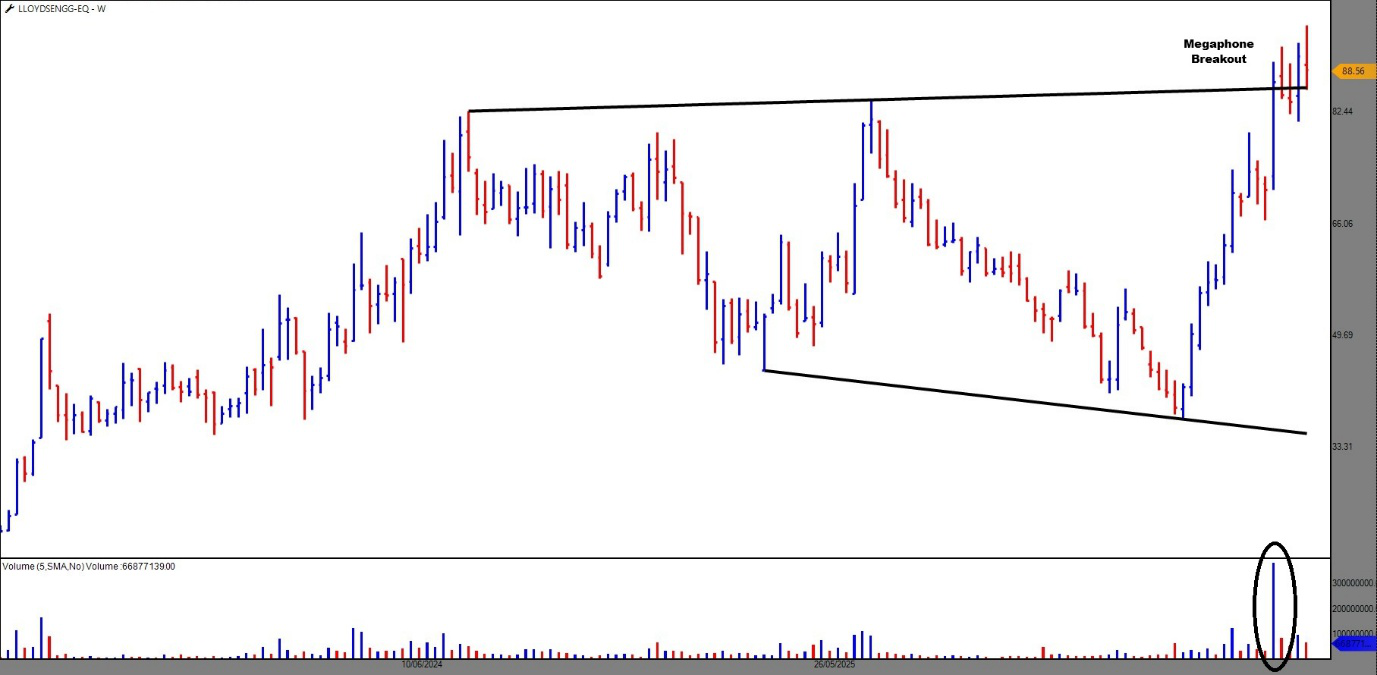
Many breakouts happen on average volume. This move came with a big spike in trading activity. Increased volume during a breakout is often a sign of strong conviction among market participants and thus increases the chances of probable trend continuation.
Since many institutional investors prefer entering positions only after confirmation, a high-volume megaphone breakout is often viewed as a strong indication of the beginning of a fresh upward trend.
Also, it is positive that the stock has hung on above the breakout level even with the short-term volatility.
If the stock continues to extend this breakout, investors may potentially add Lloyds Engineering to their watchlist.
3. South Indian Bank – Bullish Anchor Column Follow Through
Banking stocks continue to be in focus and South Indian Bank has quietly put together a technically strong setup.
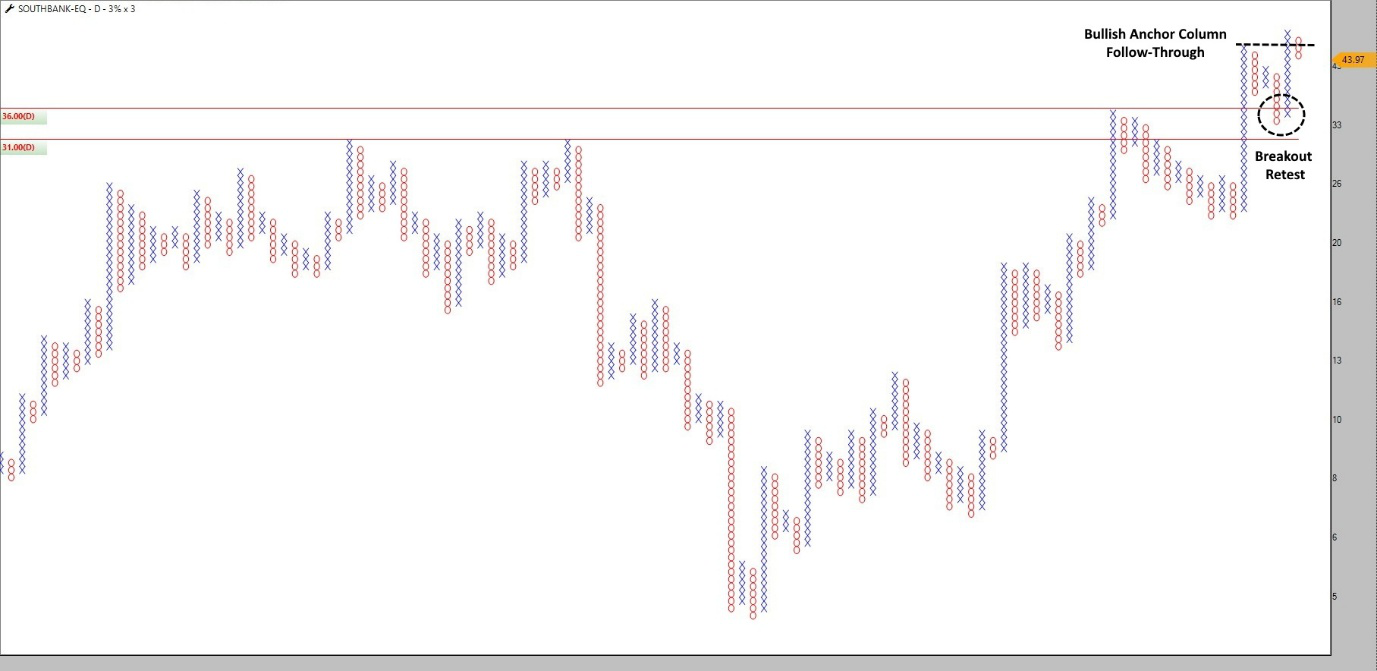
The Point & Figure chart recently generated a Bullish Anchor Column Follow-Through which is one of the more reliable continuation signals in Point & Figure methodology.
Interestingly, after breaking resistance, the stock retraced to re-test the breakout zone. These healthy retests often shake out the impatient traders before the next leg higher begins.
Buyers didn’t allow it to fall below support, they defended the area of the breakout, and this shows that former resistance now is acting as support. Such price behaviour is often a sign of a healthy trend, rather than an over-extended rally.
If the banking sector remains strong, South Indian Bank may potentially continue to outperform.
4. Ujjivan Small Finance Bank – Triangle Breakout Underway
Ujjivan Small Finance Bank has been moving sideways in a tightening range for several weeks.
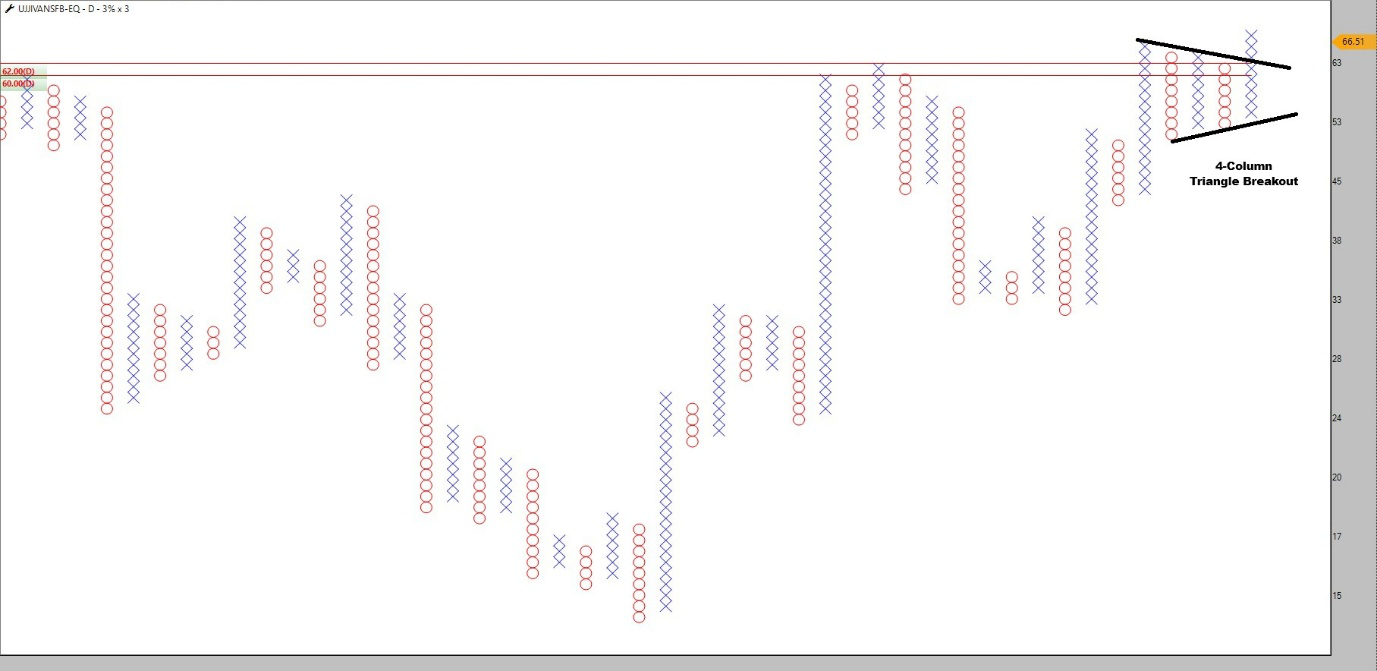
Consolidation has produced a 4-Column Triangle Breakout on the Point & Figure chart, a pattern that indicates compression before expansion.
One interesting thing about triangle breakouts is that they tend to happen after buyers and sellers have slowly come to equilibrium. Once the balance is tipped, the price will often move sharply in the direction of the breakout.
The stock has broken out of a long-term resistance area, triggering potentially bullish momentum. This is another stock for investor to add to the watchlist.
5. Lloyds Enterprises – Strong Point & Figure Trend Continuation
Lloyds Enterprises has been consolidating gains since breaking above the declining 45-degree bearish trend line on the Point & Figure chart.
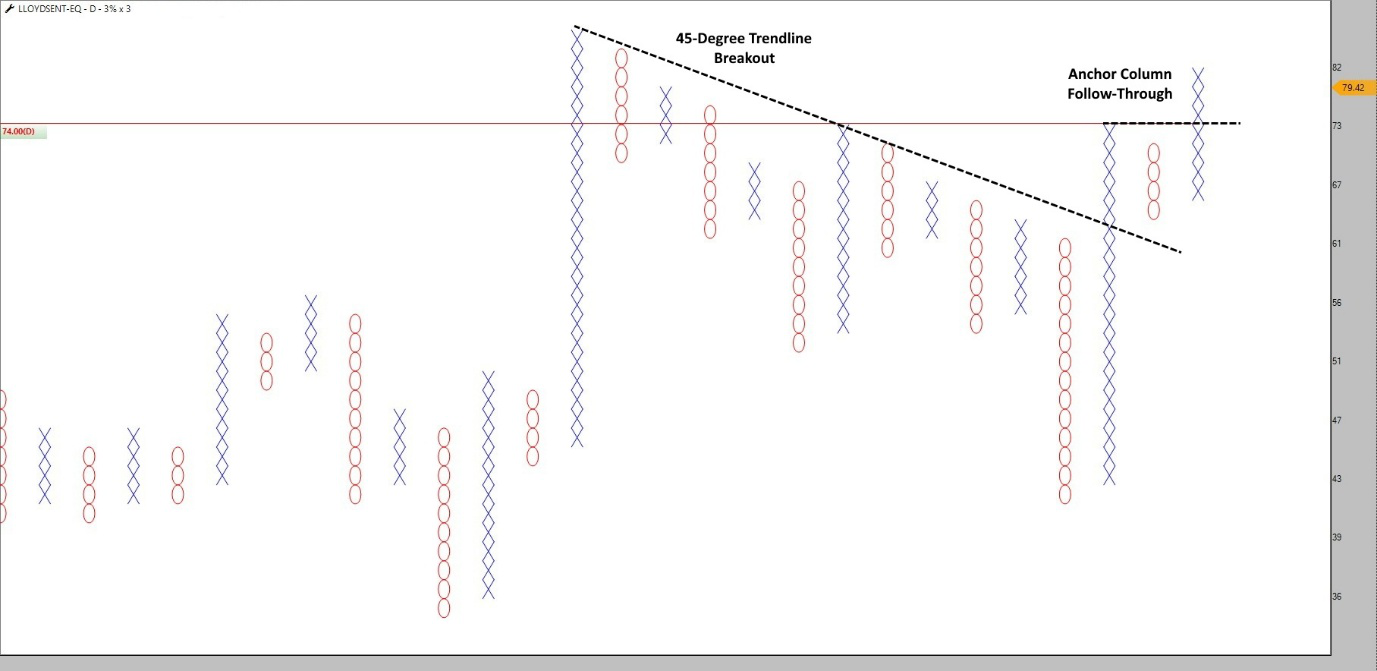
What makes this setup more interesting is the follow through Anchor Column which confirms buyers are still in control after the initial breakout.
The stock has not given back any gains, but has continued to build higher columns of Xs showing that demand is still there. Such continuation patterns are often a sign that the primary trend is still healthy.
Investors looking for opportunities may want to keep this stock on their radar.
The 5 Stocks Watchlist
Typically, shares with a price of less than Rs 100 are considered “cheap” and attract investors. But experienced traders and investors know that a low price alone does not make a stock a good investment.
The five stocks above standout not on the price, but because they are showing technically constructive setups backed by recognisable chart patterns:
- HCC – Wyckoff Accumulation, confirmed by LPS
- Lloyds Engineering – Megaphone breakout on heavy volumes
- South Indian Bank – Bullish Anchor column follow-through after decent retest
- Ujjivan Small Finance Bank – 4-Columns Triangle Breakout
- Lloyds Enterprises – Breakout from 45-degree trend line with Anchor Column confirmation
While these technical patterns indicate potential bullish momentum, no setup guarantees a return. If you are making a watchlist for the second half of the year 2026, these five sub-Rs 100 stocks are potentially worth a look. Sometimes the biggest opportunities aren’t found in the most expensive stocks; they are found in companies quietly preparing for their next breakout.
Disclaimer:
Note: The purpose of this article is only to share interesting charts, data points and thought-provoking opinions. It is NOT a recommendation. If you wish to consider an investment, you are strongly advised to consult your advisor. This article is strictly for educative purposes only.
Brijesh Bhatia is an Independent Research Analyst and is engaged in offering research and recommendation services with SEBI RA Number – INH000022075. He has two decades of experience in India’s financial markets as a trader and technical analyst.
Disclosure: The writer and his dependents do not hold the stocks discussed here.
The website managers, its employee(s), and contributors/writers/authors of articles have or may have an outstanding buy or sell position or holding in the securities, options on securities or other related investments of issuers and/or companies discussed therein. The content of the articles and the interpretation of data are solely the personal views of the contributors/ writers/authors. Investors must make their own investment decisions based on their specific objectives and resources, and only after consulting such independent advisors if necessary.