
India’s commercial vehicle (CV) industry is currently undergoing a structural recovery, driven by segment-specific growth factors. The highly cyclical Medium and Heavy CV segment (MHCVs) is rebounding due to infrastructure spending, increased mining activity, replacement-led demand, and a shift towards higher tonnage vehicles.
Light Commercial Vehicles (LCVs) are relatively more stable due to rising demand and the e-commerce boom. A defining trend in the Indian truck industry is the migration toward higher Gross Vehicle Weight segments.For manufacturers, this shift is margin-accretive, as heavier trucks command significantly higher average selling prices.
CV Players Share Price
The recent surge in CV companies’ share prices also reflects better prospects ahead. Here are three leading CV companies you can track to ride the upcycle.
#1 Tata Motors: The global pivot and the Rs 2.2 lakh crore IVECO integration
Tata Motors, a part of the Tata Group, is a market leader in the commercial vehicle industry. By 1 October 2025, the company successfully completed a demerger scheme from Tata Motors Passenger Vehicles Ltd. As of the first half of FY26, the company maintains a domestic Vahan market share of 35.3%.
Tata Motors Market Share
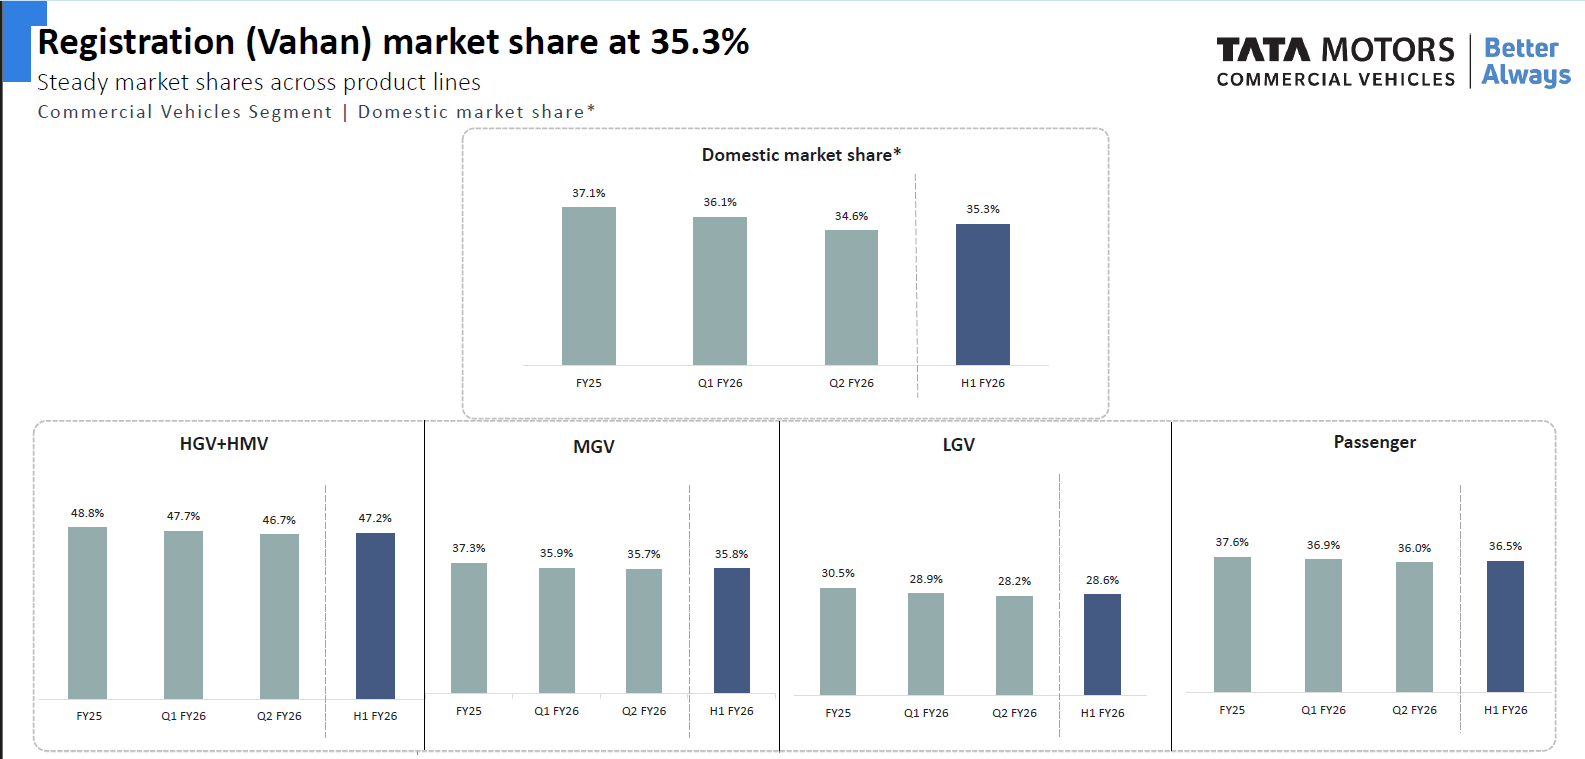
The quest for domestic market stabilization
While market shares dipped slightly early in the year, the trucks segment saw a strong rebound in the latter half of Q2. In Q2, total wholesale increased by 12% year-on-year to 97,000 units, outpacing the industry. Notably, exports rose by 75%, driven by demand from SAARC countries such as Bangladesh, Nepal, and Sri Lanka, returning international business to pre-COVID levels.
The company expects the growth momentum to continue through H2 FY26 across all segments, supported by single-digit to high single-digit growth. Growth is anticipated from the restart of mining, construction, and infrastructure projects, which will drive demand for tippers.
Export revivals and the 10% GST consumption catalyst
Increased consumption post-GST rationalization is also expected to support MHCV cargo volumes. Note that the GST on trucks has been reduced from 28% to 18%. Tata Motors was the first company to pass on the full benefit of the tax reduction to customers by lowering prices. This has boosted consumption and reduced customers’ cost of ownership by around 1%-1.5%.
The company is also evaluating participation in the PM E-Drive tender via a consortium model to maintain an asset-light structure. It has already delivered 148 Starbus Electric Vehicles to BMTC in Bengaluru and continues to ramp up volumes for the AcePro EV.
The IVECO integration: Scaling to the world’s fourth-largest player
Tata Motors is also expanding globally with the acquisition of IVECO. This merger will combine Tata Motors’ high-volume, cost-competitive manufacturing capabilities with IVECO’s premium portfolio and its access to regulated markets. It is estimated that the new company will become the fourth-largest player in the global truck market.
IVECO provides Tata Motors with deep penetration into Europe and South America. This diversification aims to stabilize earnings across different market cycles, reducing dependence on the Indian domestic CV cycle. Following the integration, Tata Motors’ consolidated revenue is expected to exceed ₹2 lakh crore.
Tata Motors Financials Snapshot
From a financial perspective, revenue increased 6.6% year-on-year to ₹18,400 crore in Q2FY26, driven by higher volumes and realizations. The EBITDA margin increased by 150 basis points (bps) to 12.2%. Consequently, profit before tax (PBT) before exceptional items stood at ₹1,700 crore, compared with ₹1,200 crore in H1 FY26.
We have used PBT to offset the impact of the ₹2,000 crore mark-to-market loss. This loss was linked to the company’s investment in Tata Capital, which listed at a price 20%-25% below the previously expected valuations. EBITDA stands for earnings before interest, tax, depreciation, and amortisation.
#2 Ashok Leyland: Capitalizing on the 10-year fleet replacement super-cycle
Ashok Leyland, part of the Hinduja Group, is India’s second-largest CV player. It manufactures a wide range of commercial vehicles, including trucks and buses, as well as engines for industrial and marine applications. It is India’s leading manufacturer in the M&HCV bus segment.
Ashok Leyland posted strong domestic volumes and robust export growth. Domestic MHCV truck volumes for Q2 stood at 21,647 units, while MHCV bus volumes were 4,660 units. For H1 FY26, the company’s domestic MHCV market share increased by 50 basis points to 31%.
Export footprints and the rise of the electric subsidiary
Domestic sales of light commercial vehicles (LCVs) increased by 6.4% to 17,697 units in Q2. The LCV market share in H1 grew by 0.9% to 13.2%. Export volumes also saw a significant increase, rising by 45% year-on-year to 4,784 units in Q2 FY26 and by 38% in H1 FY26. This growth was driven by a strong local presence in the GCC, Africa, and SAARC regions.
The company’s non-commercial vehicle divisions also posted significant revenue growth. Aftermarket business grew by 11%, power solutions by 14%, and defence increased by 25%. The electric vehicle subsidiary (Switch India) sold nearly 600 buses and 600 e-LCVs in H1. It became both EBITDA- and PAT-positive during the first half of the year.
Management expects H2 FY26 to be better than H1, both in terms of overall industry volumes and growth rate. This expectation is supported by the October data, which showed a 7% year-on-year growth in the MHCV segment and a 15% growth in the LCV category. It also cited the reduction in GST rates as a key driver of this growth.
Why a 10-year fleet age triggers a buying surge
Growth in the MHCV segment is anticipated to be led by broad-based demand and increased infrastructure and government capital expenditure. The average age of the Indian truck fleet has reached about 9.5-10.5 years, suggesting a strong latent demand for newer, more efficient BS-VI vehicles that offer better mileage and turnaround times
To capitalise on demand, the company is preparing to launch a new range of heavy-duty trucks in Q3 and Q4 FY26. These vehicles will feature in-house 6-cylinder engines and are positioned as premium products to command better prices and margins.
Doubling capacity for the EV era
New launches are also planned in the bus segment. The upcoming inauguration of the Lucknow plant will eventually help increase total bus body-building capacity from 12,000 to over 20,000 units per year.
From a financial perspective, Ashok Leyland’s revenue increased by 9.3% year-on-year to ₹9,588 crore, driven by volume growth. EBITDA rose by 14.2% to ₹1,162 crore, while margins expanded by 50 bps to 12.1%. Profit after Tax increased 6.9% to ₹820 crore. The company expects margins to improve in H2 of FY26, driven by lower commodity costs. It aims to reach mid-teen EBITDA.
#3 Mahindra & Mahindra: The LCV coup and the 53.2% market share milestone
Mahindra & Mahindra, a part of the Mahindra Group, also operates in the Commercial Vehicle division. The company is India’s No. 1 manufacturer of < 3.5T Light Commercial Vehicles and the No. 1 electric 3-wheeler company. Mahindra holds a dominant 48.9% market share in the LCV segment as of FY25.
The turnaround of the Truck and Bus division
Mahindra Trucks and Buses division offers a wide range of vehicles, including the Blazo X, Furio, and various bus models. The segment achieved a major milestone in FY25 when the truck and bus division reached cash break-even and recorded positive EBITDA. That said, the segment saw a positive turn in Q2, ending a prolonged period of flattish volumes.
Mahindra’s market share in the LCV segment increased by 100 bps year over year to 53.2%. The company sold 13% higher volumes than in the same period last quarter. Management noted that the positive trend is finally kicking in after many quarters of stagnant growth. This recovery is closely tied to the tax cut.
How tax relief unlocked the LCV volume trap?
Management views the recent reduction in GST as a critical catalyst for demand. It noted that over the last five years, the segment faced unprecedented price increases of 25% to 30% driven by high commodity costs and the transition to BS6 and BS6.2 regulations. These increases acted as a “major drag” on growth because fleet owners could not pass the costs on to customers.
It states that the GST relief is effective because approximately 60% of the buyers are individuals and small aggregators who cannot claim GST set-off. For these buyers, the tax reduction directly translates into a lower purchase price. The company doesn’t report separate CV financials.
Valuations reflect the cycle, Not the peak
Tata Motors is a newly listed company, so limited information is available. The loss in Q2 of FY26 further makes it tough to fetch the return ratios. That said, valuation-wise, Tata Motors is trading at a premium EV/EBITDA multiple of around 24.5– showing its market leadership. The company is expected to see renewed optimism after the demerger.
Ashok Leyland, a pure-play CV company, is trading near the median multiple but below the industry valuation. It also boasts a strong return ratio: Return on Capital Employed (14.3%) and Return on Equity (28.8%). M&M, as a consolidated entity, performed much better. Even after a sharp rerating, the company continues to trade at a discount.
Valuation Assessment (X)
| Company | EV/EBITDA | 5-year Median EV/EBITDA | Industry Median EV/EBITDA | RoCE (%) | RoE (%) |
| M&M | 14.6 | 12.4 | 19.7 | 13.9 | 18.0 |
| Tata Motors | 24.5 | NA | 18.0 | NA | NA |
| Ashok Leyland | 14.7 | 14.0 | 14.3 | 28.8 |
To conclude, in a cycle where volumes are being driven by infrastructure, mining, and replacement demand, the CV upcycle appears more durable than past recoveries. Tata Motors offers scale, global diversification, and operating leverage, but valuations already reflect much of the optimism. Ashok Leyland and Mahindra & Mahindra, trading closer to historical averages, may offer a more balanced risk–reward as the cycle unfolds and margins gradually improve.
Whether the turnaround in the CV cycle holds, and how these companies perform, we will only come to know in time. But given the potential for growth, it may be worthwhile to add these stocks to one’s watchlist.
Disclaimer
Note: Throughout this article, we have relied on data from http://www.Screener.in and the company’s investor presentation. Only in cases where the data were not available have we used an alternate, widely used, and accepted source of information.
The purpose of this article is only to share interesting charts, data points, and thought-provoking opinions. It is NOT a recommendation. If you wish to consider an investment, you are strongly advised to consult your advisor. This article is strictly for educational purposes only.
About the Author: Madhvendra has been deeply immersed in the equity markets for over seven years, combining his passion for investing with his expertise in financial writing. With a knack for simplifying complex concepts, he enjoys sharing his honest perspectives on startups, listed Indian companies, and macroeconomic trends.
A dedicated reader and storyteller, Madhvendra thrives on uncovering insights that inspire his audience to deepen their understanding of the financial world.
Disclosure: The writer and his dependents do not hold the stocks discussed in this article.
The website managers, its employee(s), and contributors/writers/authors of articles have or may have an outstanding buy or sell position or holding in the securities, options on securities or other related investments of issuers and/or companies discussed therein. The articles’ content and data interpretation are solely the personal views of the contributors/ writers/authors. Investors must make their own investment decisions based on their specific objectives, resources, and only after consulting such independent advisors as may be necessary.