

India is currently the world’s fastest-growing office market. This is fueling the rise of the flexible workspace (coworking sector), which is the fastest-growing segment in commercial real estate. Numbers also demonstrate the same. The market share of the managed workplace model reached 30% in FY24, up from just 8% in FY18. Global capability centers, hybrid work models, and outsourcing fuel demand from large enterprises.
Also, flexible workspaces now account for about 20% of total office demand in India. Per Smartworks‘ annual report, the sector grew at a compound annual growth rate (CAGR) of about 24% from 2020 to 2024. This momentum is projected to continue, and the total stock of flexible workspaces in Tier 1 cities is projected to grow at a CAGR of 18-20% from 2024 to 2027. As such, three public companies are expected to benefit from this shift. Let’s take a look…
#1 Smartworks: The enterprise-focused pioneer
Smartworks pioneered India’s managed office platform model and is currently the largest managed office platform by total managed square foot area (12 million square feet (msf)). The company primarily operates as an office experience and managed office platform built for global and Indian enterprises. Smartworks has grown 1.5x of the industry during 2020-24.
Expanding footprint across key micro-markets
The company has 56 centers across 15 cities, covering approximately 94% of locations in the country’s key micro-markets. Of 12 msf, 8.3 msf are currently operational, representing around 190,000 operational seats, with 83% occupancy. Smartworks aims to add 2.5-3 msf annually, and expects to add 40,000 additional seats in the ongoing financial year.
Enterprise clients drive stable annuity growth
Smartworks primarily serves medium-to-large enterprise clients, contributing over 85% of the company’s revenue. Its business model involves acquiring large bare-shell buildings from landlords and converting them into branded campuses. Smartworks leverages standardization, modularity, and economies of scale to achieve industry-leading costs.
Margins strengthen on operating leverage and scale
From a financial perspective, Smartworks revenue rose 21% year-on-year to ₹3.8 billion, driven by core annuity business, and 5% year-on-year escalation. About 94% of the revenue came from annuity-based lease rentals. Also, revenue contribution from enterprise clients stood at around 90%.
Smartworks Financial Performance
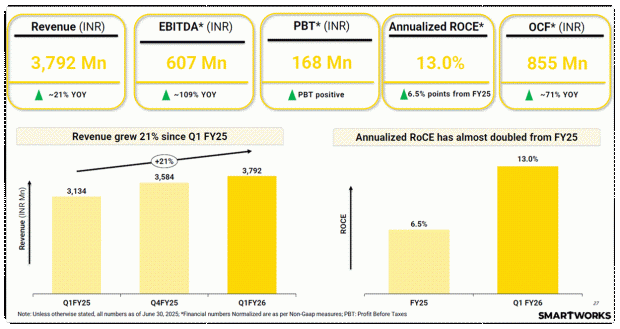
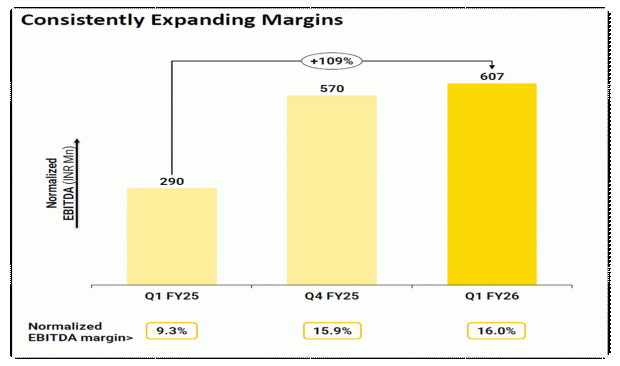
Normalized EBITDA (earnings before interest, tax, depreciation, and amortization) rose 109% to ₹607 million. Normalized numbers are as per Non-GAAP measures. As such, EBITDA margin expanded by 670 basis points (bps) to 16%. Net loss narrowed to just Rs 42 million, from Rs 230 million in the June quarter last year. RoCE also doubled to 13%, and is expected to double again in the next two years, with further upside expected over the subsequent five years.
Operating Leverage is driving Margins Higher.
Scaling growth with a path to profitability
Looking ahead, the company is uniquely positioned to capture market share due to its ability to scale rapidly. It plans to add 2.5 to 3.0 million square feet (Msf) of space annually, typically requiring acquiring seven to eight whole buildings annually. Management also estimates a continued annual growth rate of 25-30%.
The total operational seat count is expected to increase from 190,000 seats to 275,000 seats within the next 4 to 5 quarters. Additionally, the company primarily focuses on its core annuity business (rental income), where it sees the greatest potential for market share growth. The company also estimates that about 75% of rental annuity income will continue to come from the top six cities.
Smartworks is targeting to become free cash flow positive soon. Normalized EBITDA margin (16.0% in Q1FY26) is expected to expand further. Operating leverage will drive this expansion as new centers mature, increasing occupancy and utilization in H2 of FY26. Smartworks is also expanding overseas, entering Singapore with 2 centers.
#2 IndiQube: The Bengaluru leader diversifying fast
IndiQube commands about 21% market share in the flexible workspace segment in Bengaluru, the fastest-growing commercial real estate hub globally. Bengaluru’s share of IndiQube’s overall portfolio has decreased from 90% to 65%, indicating successful diversification.
IndiQube provides integrated workplace solutions through four core components: GROW (plug-and-play workspaces), BESPOKE (office interiors), ONE (workplace management services), and MIQUBE (workspace technology stack). Additionally, CORNERSTONE also renovates older properties through technology and facility improvements.
Enterprise clients anchor occupancy and revenue
As of Q1FY26, the company manages 8.7 msf workspace in 120 centers across 15 cities. The total seats stand at 193,000, with a strong occupancy of 85% (up from 81% in Q1FY25). The company has 789 clients, of which 40% are global capability centers and 60% are Indian. Clients occupying 300+ seats accounted for 64% of the total occupancy, underscoring the focus on large, long-stay enterprise clients.
Margins expand on strong recurring growth
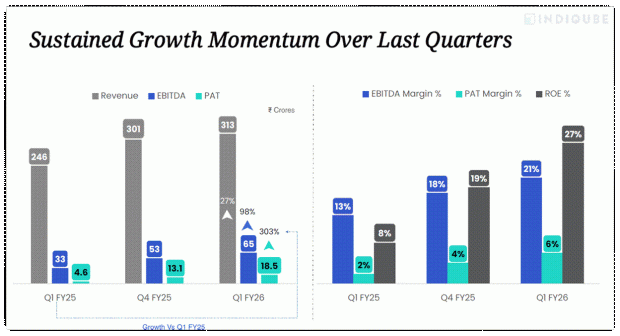
The company’s revenue in Q1FY26 rose by 27% year-on-year to ₹3.1 billion. IndiQube’s financial growth depends on its recurring revenue, which accounted for 98% of revenue. EBITDA rose 98% to ₹650 million, with margin expanding by 800 bps to 21%. Profit after tax (PAT) grew by 303% to ₹185 million, albeit from a low base. With higher profitability, Return on Equity (RoE) expanded by 1900 bps to 27%.
Strong Financial Performance in Quarter One
Built-in capacity to fuel future growth
Looking ahead, the company has historically delivered 30% year-on-year revenue growth and expects to maintain a similar trajectory. New center additions, strong occupancy rates, and recurring nature of its revenue (98%) provide a “strong foundation for future growth. IndiQube also anticipates margins to be around 21% in the coming quarters.
In addition, the company has a significant built-in capacity for expansion, with 2.2 msf of headroom currently available (the difference between 8.70 msf total area and 6.50 msf rentable area). This 2.2 msf of headroom is expected to become operational for occupancy within 6 to 12 months. Based on the current occupancy rate of 85%, this equates to about 1.87 msf of potential rent-yielding area.
#3 WeWork India: Scale through direct leases
WeWork is one of India’s largest companies in the co-working industry. The company is backed by Embassy Group, a leading Indian developer with a portfolio of over 85 msf. WeWork leases space from Embassy Group and major landlords such as Prestige Estates, DLF, and K Rahega Group.
Direct lease model drives scale and control
WeWork currently has 68 operational centers (as of June 2025), of which 60 operate under a direct lease business model. Under this model, the company leases bare-shell properties from landlords for a long period of time at a fixed cost. In contrast, in the operator model, it manages and maintains the centers on behalf of the landlords.
The company has 121,700 desks, of which 114,100 are operational, with an occupancy of 76.5%. These desks are geographically diverse, with Bengaluru contributing 41.2% of the total, followed by Mumbai at 15.5%, Pune at 13.1%, Gurugram at 10.3%, Hyderabad at 8.5%, Chennai at 7.5%, Noida at 3.2%, and Delhi at 0.7%. Bengaluru contributes 61% of revenue, while Mumbai contributes 21%.
Enterprise clients anchor revenue across cities
It has 2,215 clients, including enterprise clients such as Amazon, JPMorgan, Uber, Dyson, Khaitan & Co., Warner Bros., and Cushman Wakefield. They account for 76.5% of revenue, while the remainder comes from non-enterprise clients. It’s worth noting that about 44.3% of members occupy over 300 seats, 101- 300 seats (19.8%), and 51-100 seats (11.7%).
From a financial standpoint, revenue rose 19.3% year-on-year to ₹5.3 billion in Q1FY26, driven by growth across membership and ancillary services, driven by capacity addition. Membership revenue rose 18.5% to ₹4.6 billion, accounting for 86.8% of total revenue. Service and ancillary revenue also rose 20.7% to ₹529 million.
The company’s EBITDA increased 18.5% to ₹3.3 billion, while margins declined 44 bps to 62.7%. Net loss halved to ₹141 million in Q1FY26, from a loss of ₹295 million in Q1FY25. Higher depreciation, amortization, and financial costs continue to impact the bottom line. However, WeWork still generates significant cash flow yearly due to strong operational profitability.
Driving growth through efficiency and diversification
Looking ahead, management aims to improve economic performance by optimizing pricing, leveraging cross-selling of ancillary services, maintaining low variable costs, and controlling corporate overheads. Within ancillary services, the Company plans to invest in new products and technology to diversify revenues, including broadening its value-added services.
Valuation check: Is the growth already priced in?
We have used the EV/EBITDA multiple to assess their valuation. Since these companies are newly listed, historical comparisons are not possible. Accordingly, WeWork is trading the cheapest at 6.8x, followed by Smartworks at 11.3x and IndiQube at 13.4x. Except for WeWork, both are trading above the median EV/EBITDA multiple of 10.9x.
Valuation Comparison (X)
| Company | EV/EBITDA |
| WeWork | 6.8 |
| Smartworks | 11.3 |
| IndiQube | 13.4 |
| Industry Median | 10.9 |
This indicates that the market is factoring in strong growth expectations and the potential for continued expansion in India’s flexible workspace sector, signaling confidence in their scale, recurring revenue models, and operational strength. IndiQube trades at a premium due to its strong profitability, while Smartworks and WeWork are still posting bottom-line losses. If WeWork improves profitability, its valuation could rerate.
Disclaimer
Note: Throughout this article, we have relied on data from http://www.Screener.in and the company’s investor presentation. Only in cases where the data was not available have we used an alternate but widely used and accepted source of information.
The purpose of this article is only to share interesting charts, data points, and thought-provoking opinions. It is NOT a recommendation. If you wish to consider an investment, you are strongly advised to consult your advisor. This article is strictly for educational purposes only.
About the Author: Madhvendra has been deeply immersed in the equity markets for over seven years, combining his passion for investing with his expertise in financial writing. With a knack for simplifying complex concepts, he enjoys sharing his honest perspectives on startups, listed Indian companies, and macroeconomic trends.
A dedicated reader and storyteller, Madhvendra thrives on uncovering insights that inspire his audience to deepen their understanding of the financial world.
Disclosure: The writer and his dependents do not hold the stocks discussed in this article. The website managers, its employee(s), and contributors/writers/authors of articles have or may have an outstanding buy or sell position or holding in the securities, options on securities, or other related investments of issuers and/or companies discussed therein. The articles’ content and data interpretation are solely the personal views of the contributors/ writers/authors. Investors must make their own investment decisions based on their specific objectives, resources, and only after consulting such independent advisors as may be necessary.