")
As we move into the last month of 2025, the markets are acting like that one unpredictable travel buddy who sometimes speeds ahead with excitement to hit the new highs and sometimes leaves you speechless with sudden changes. The Nifty50 hit a new all-time high of 26,310, but a lot of investors are looking at their portfolios and quietly saying, “But why do you still look like March?“
December is a month of winding down all over the world, but especially in the US. Traders make money, funds get their money back, and the terminals go into holiday mode.
But what about India? We don’t slow down; we change gears.
In India, December means weddings, road trips, crowded airports, sold-out hotels, and, as a result, an Instagram feed full of mountains, beaches, and more mountains.
If travel is the mood of the country, can markets stay the same?
Now things get interesting. We did a Seasonality Analysis on all the NSE sectors, and like a well-timed end-of-year surprise, Nifty India Tourism stood the best performing sector for December.
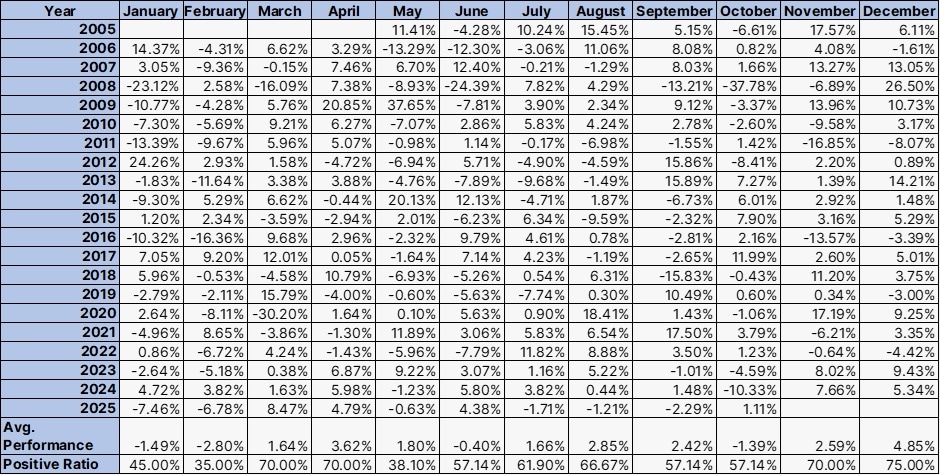
With average gains of 4.85% for the month of December stands out to be the best month for the sector.
In the past, this industry has done very well in December. It makes perfect sense as there is more travel, more people coming in, more bookings, and of course, more money. But even the charts tell a strong story, not just logic.
Nifty India Tourism Daily Chart
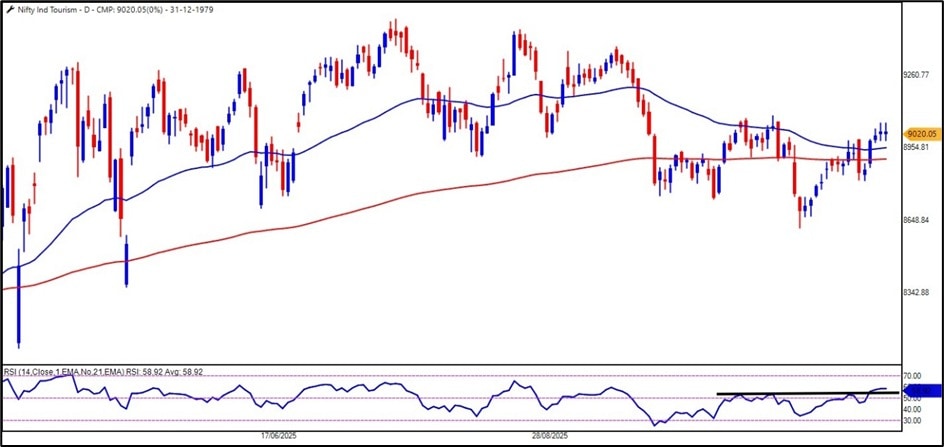
The index is going up steadily on the daily chart. A Golden Cross means that the structure is strong and the market is saying, “The trend is healthy.” “I’m not going anywhere.”
Indicators of momentum give you more confidence. The RSI has made a classic bullish range shift, going up from the 50 level and staying strong. When the RSI moves into a bullish range, it usually means that the trend underneath it has more room to grow.
Along with seasonality in the index, we checked each stock’s short-to-medium term trend using the D-Momentum Score, a quick snapshot of the underlying momentum.
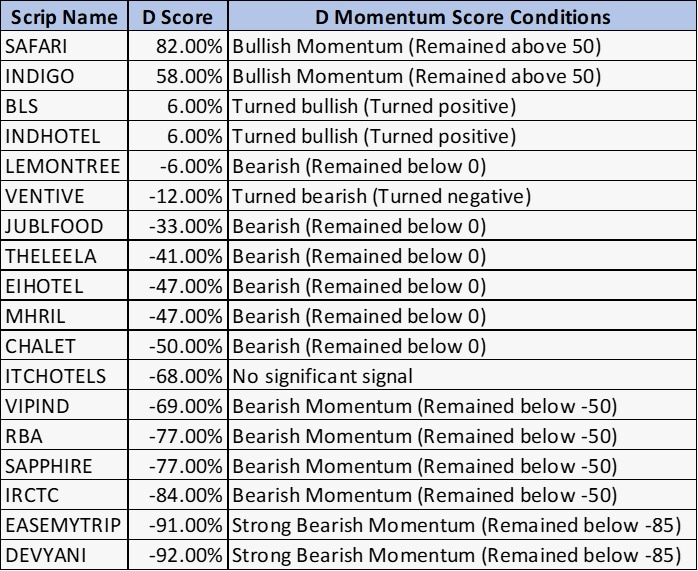
Two stocks that are trending bullish as per the D-Momentum Score are Safari and Indigo. Let us analyse their charts.
#1 Safari Industries: A Clean Breakout on Heavy Volume
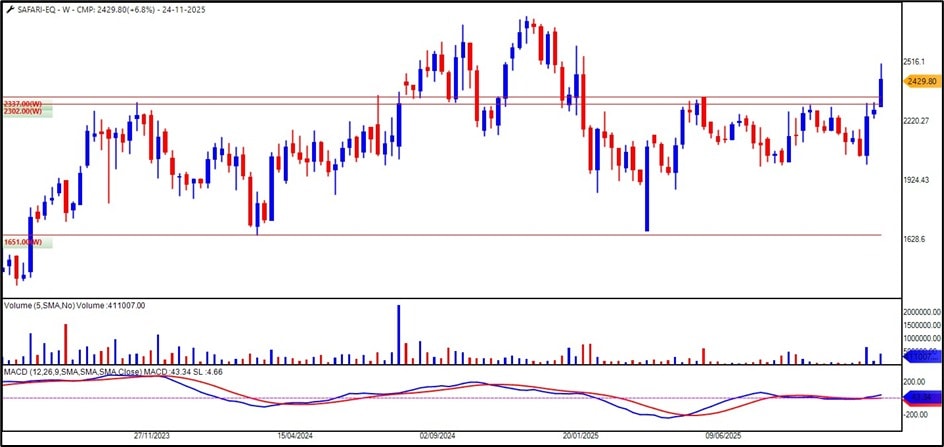
On the weekly chart, Safari Industries has finally broken out of a tight consolidation zone with a clean breakout and good volume. When volumes rise both before and after a breakout, it usually means that people are buying with knowledge.
The stock has also built a strong base on a two-year horizontal support, which shows that the floor is solid.
The MACD shows a bullish crossover above the zero line, which makes the trend stronger. The structure negates below Rs.2,180, and a possible retest zone is between Rs. 2,300 and Rs.2,350.
#2 Indigo: Breaking the Downtrend Ahead of Peak Travel
Indigo has broken out of a 45-degree four-column Triangle pattern on the 0.25% x 3 Point & Figure chart. This means that the trend is clearly moving from consolidation to continuation.
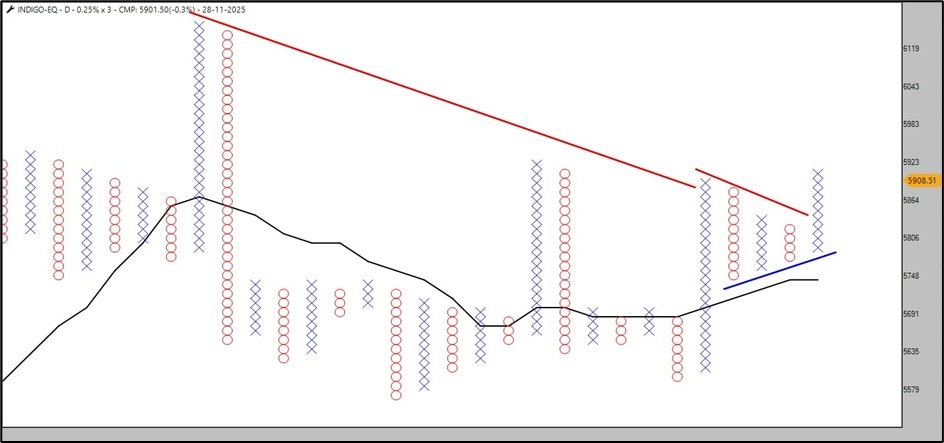
Even more importantly, the long-term downtrend line from its all-time high of Rs. 6,232 has finally been broken. This indicates the bearish tone is over, and a new trend may be starting.
The momentum is picking on the stock price as it is on the runway and potentially getting ready to take-off with holiday travel at its peak.
Travel or do business? Why not both?
Themes provide the narrative. Seasonality makes sense. The signal comes from momentum. But timing is the secret ingredient.
Chasing trades rarely pays off; catching them at your price often does.
The markets may still act strangely as 2025 comes to an end. But chances will keep coming up. They might be in clear places, in underdogs, or even in something as simple as the excitement of the holiday season turning into a market trend.
I hope you have a profitable December, a happy end of the year, and a market journey in the next few months that is rewarding.
Have a great time trading and travelling!
Disclaimer:
Note: The purpose of this article is only to share interesting charts, data points and thought-provoking opinions. It is NOT a recommendation. If you wish to consider an investment, you are strongly advised to consult your advisor. This article is strictly for educative purposes only.
Brijesh Bhatia is an Independent Research Analyst and is engaged in offering research and recommendation services with SEBI RA Number – INH000022075. He has two decades of experience in India’s financial markets as a trader and technical analyst.
Disclosure: The writer and his dependents do not hold the stocks discussed here.
The website managers, its employee(s), and contributors/writers/authors of articles have or may have an outstanding buy or sell position or holding in the securities, options on securities or other related investments of issuers and/or companies discussed therein. The content of the articles and the interpretation of data are solely the personal views of the contributors/ writers/authors. Investors must make their own investment decisions based on their specific objectives and resources, and only after consulting such independent advisors if necessary.