")
The Nifty IT Index closed 2025 with a painful -12.58% return, leaving investors who had chased momentum all year with a bad taste in their mouths. The IT sector that used to show off India’s tech strength around the world was no longer popular.
But markets, like the weather, are always changing.
The same IT Index that let us down in 2025 is now telling a different story through its charts.
A story of reversal, accumulation, and a quiet return of bullish intent.
If you pay close attention, the technicals are hinting that IT might be the hot sector of the year. Infosys and Tech Mahindra are two big companies in this sector that are not only following the index but also leading it north.
Let’s look at the charts and see why IT might be the one to write the script for 2026.
Nifty IT Weekly Chart: The Base Is Built, The Breakout Beckons
There is always a time of disbelief before a strong rally. The Nifty IT Index seems to be in that exact area right now.
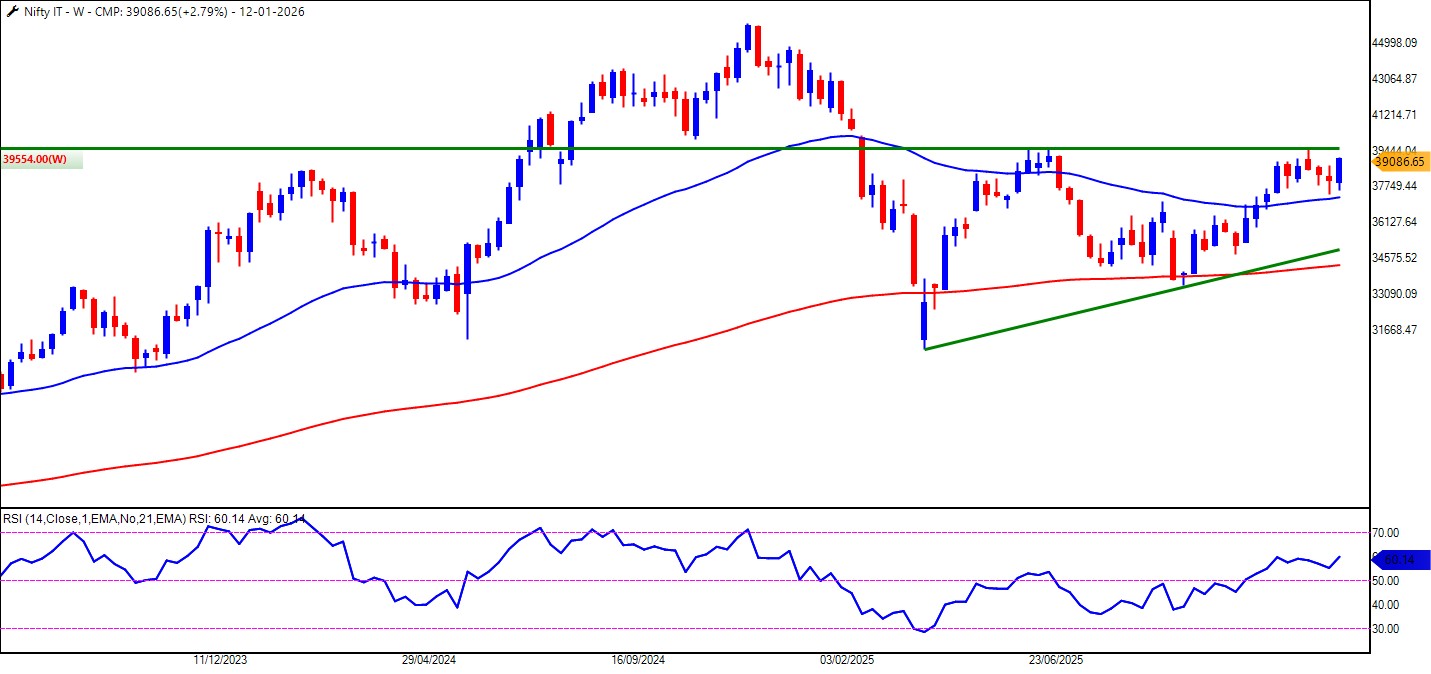
The index found its footing in Q4 of 2025 after a tough year in 2025 by sharply reversing from the 200-week Exponential Moving Average (200WEMA).
Technical Indicators: The 200WEMA and Golden Cross
For people who look at charts over a long period of time, this level is more than just another line on the screen. It’s a place where institutions often step in, long-term trend followers reevaluate value, and big money quietly builds positions.
The index didn’t just bounce back, which is more important. It “formed a higher low,” which is a classic early sign that sellers are losing control and buyers are starting to defend levels aggressively.
Now step back and look at the bigger picture of the trend.
The Nifty IT Index is in a “Golden Cross” setup, which means that the faster moving average stays above the slower one. The long-term trend is still bullish, even though the short-term story went through a rough patch in 2025.
The price reclaiming and staying above the 50WEMA makes this argument stronger. This change is often the start of a trending phase after a corrective phase. In market terms, this means that bulls are no longer just reacting; they are taking the lead.
The index is forming an ascending triangle pattern in terms of its structure. This pattern is made up of a rising base of higher lows pushing against a flat or slightly sloping resistance. It shows a market where buyers are getting more aggressive and willing to step in at higher and higher levels, while sellers are protecting a set area.
The RSI range shift adds to this bullish bias. The range shift indicates the bulls are leading its way.
All of these things together show that the index is not only recovering but also getting ready to move in a certain direction. And history shows that when sectoral indices break out of long consolidations, the stocks that lead the way often go faster and farther.
That leads us to the two names that could tell the story of IT in 2026.
Infosys Ltd: An Ascending Triangle Breaker
Infosys has always been a leader in the IT field. When it moves with purpose, the rest of the industry often follows.
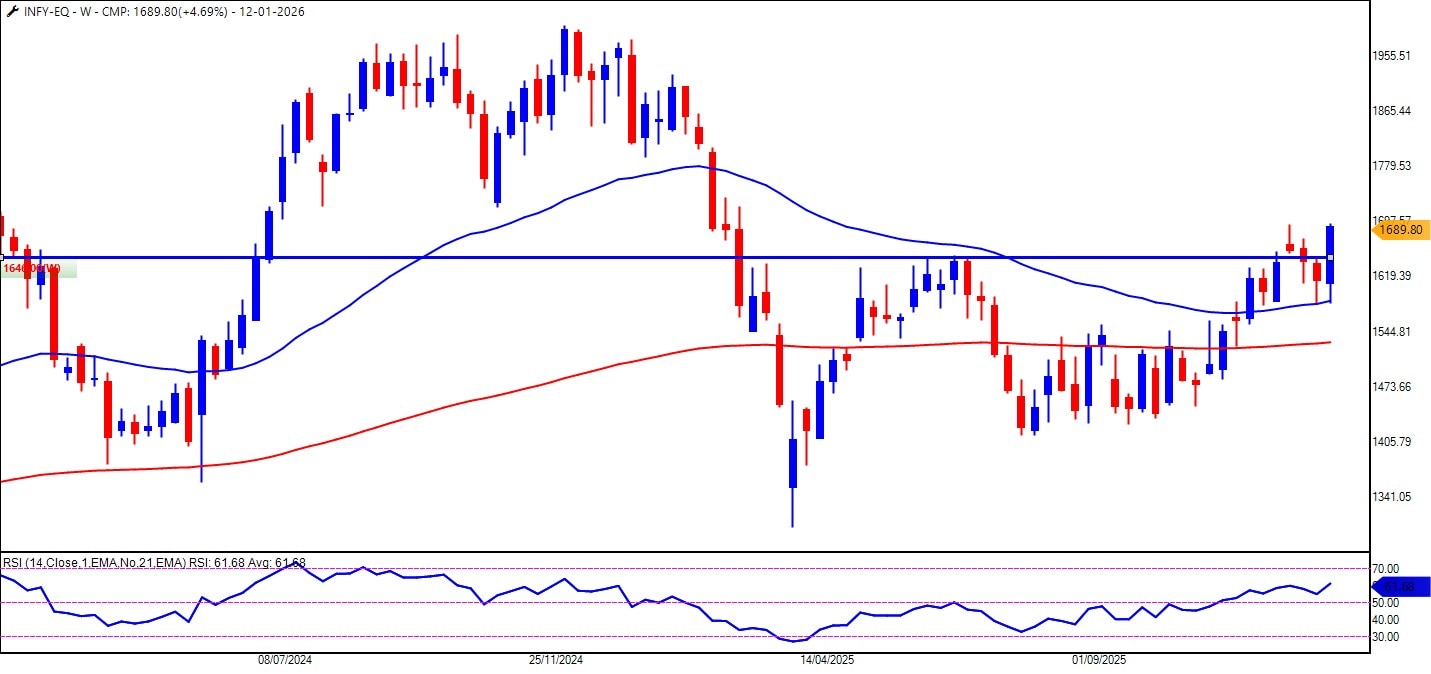
Infosys has made a clean, textbook move on the weekly chart. The stock broke out of an ascending triangle, which means that the long period of consolidation is finally over and the bulls have won.
The retest of the 50WEMA makes this breakout stronger from a technical point of view. The price didn’t drop after the breakout; instead, it went back down to test this moving average and then continued to go up. This kind of behaviour is a classic sign that a trend is developing in a healthy way. It shows that what used to be resistance or a mean reversion zone is now support.
The Relative Strength Indicator (RSI) says “Price tells you what’s going on,” is something that momentum traders say a lot. It tells you how strong it is. The RSI has made a “bullish range shift” for Infosys. Instead of going too low during pullbacks, it is now getting support around higher levels.
This change in behaviour makes it look like people are buying dips instead of selling them. The market isn’t looking for exits anymore; it’s looking for entries.
In the long run, Infosys is aligning several timeframes in the same direction. The pattern of higher highs and higher lows is still there. The moving averages are stacked in a way that is good for the market. And momentum is backing up the price.
All of this makes me think of something interesting as a retest and probable breakout into new all-time high territory in 2026.
Tech Mahindra: The Fibonacci Time Breakout
If Infosys is the steady general of the industry, Tech Mahindra is like the quiet warrior who surprises everyone when the battle starts.
Tech Mahindra has done something technically rare and powerful on the weekly chart. The stock has broken out of a symmetrical triangle pattern that lasted for 55 weeks. This isn’t just a pattern in prices. It fits perfectly with the idea of a Fibonacci Time Cycle.
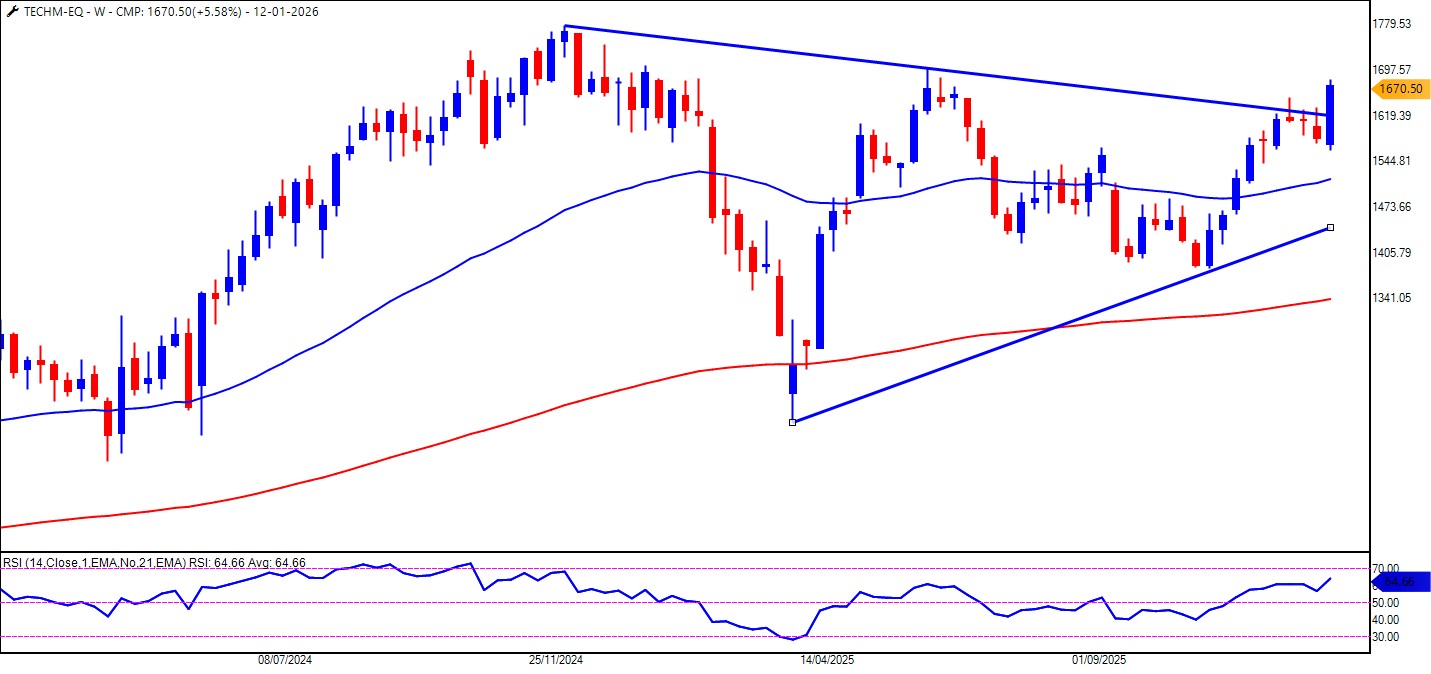
Breakouts based on time often have different meanings. They say that the market has not only cleared up price uncertainty, but it has also gone through a full cycle of accumulation and distribution. Trends tend to last longer than most people think when both price and time are right.
Tech Mahindra’s chart also shows a “Golden Cross,” which means that the overall trend has moved back in favour of the bulls. The stock’s reversal from the 200WEMA gives investors even more confidence in the long term. This area is once again a battleground where long-term investors usually draw their line in the sand.
The RSI on Tech Mahindra is going up steadily, not in big jumps. Traders who follow momentum profiles love this kind of trend. It suggests that a lot of people are involved, not just those who are betting on short-term gains.
As long as RSI stays above its mid-zone and keeps making higher lows, the chances of outperforming the index stay high.
Why These Two Could Be the Leaders in IT in 2026
When a sector changes, leadership is more important than participation. The Nifty IT Index is starting to show signs of a “trend transition” from correction to possible growth. During these times, large-cap leaders often draw in institutional flows. They give you liquidity, visibility, and technical clarity.
Infosys offers structure and stability. It has a clean breakout, support from moving averages, and a bullish RSI profile, which makes it a classic trend-following candidate.
Tech Mahindra brings alignment of time and momentum. It could surprise on the upside because it broke out of its Fibonacci cycle and reversed its long-term trend. This is especially true if the broader index confirms its ascending triangle breakout.
They are two different flavours of the same bullish theme as one based on price structure and the other based on time cycles.
Disclaimer:
Note: The purpose of this article is only to share interesting charts, data points and thought-provoking opinions. It is NOT a recommendation. If you wish to consider an investment, you are strongly advised to consult your advisor. This article is strictly for educative purposes only.
Brijesh Bhatia is an Independent Research Analyst and is engaged in offering research and recommendation services with SEBI RA Number – INH000022075. He has two decades of experience in India’s financial markets as a trader and technical analyst.
Disclosure: The writer and his dependents do not hold the stocks discussed here.
The website managers, its employee(s), and contributors/writers/authors of articles have or may have an outstanding buy or sell position or holding in the securities, options on securities or other related investments of issuers and/or companies discussed therein. The content of the articles and the interpretation of data are solely the personal views of the contributors/ writers/authors. Investors must make their own investment decisions based on their specific objectives and resources, and only after consulting such independent advisors if necessary.