
")
India’s wedding season has arrived like a travelling carnival. Every weekend, neighborhoods are lighting up, bands are tuning their trumpets, and families are juggling guest lists the way stock traders track closing prices. The scale is familiar, the excitement is predictable, and yet every year the “big fat Indian wedding” somehow finds a way to get bigger, louder and costlier.
This year, the numbers show just how large the wave could be. According to estimates by the Confederation of All India Traders, nearly 46 lakh weddings are expected between November 1 and December 14, generating close to Rs 6.5 lakh crore in spending over just six weeks. The impact is already visible, with jewellery stores, fashion labels, hotels, salons and event planners preparing for a sharp surge in demand as the country steps into its busiest social season.
Broadly, wedding spends fall into six pockets —
- Jewellery,
- Ethnic fashion and wedding wear,
- Destination hotels and banquets,
- Beauty and grooming,
- Catering, and
- Photography or wedding films.
These categories cover almost everything a family spends on, from the gold bought months in advance to the final edits of the reception video.
But when it comes to the stock market, the investable universe is smaller. Only four of these six categories have meaningful presence from organised, publicly listed players. These are segments where national brands dominate, supply chains are formal, and scale is already visible.
Meanwhile, catering and photography, despite being large spend areas, continue to be run mainly by regional outfits and boutique operators. That is why the analysis focuses on the four organised categories that genuinely reflect the wedding boom in the listed space.
#1 Titan Company: The gold standard of wedding wealth
Titan Company, a Tata group company, is among India’s most respected lifestyle companies. It has established leadership positions in the watches, jewellery and eyewear categories led by its trusted brands and differentiated customer experience.
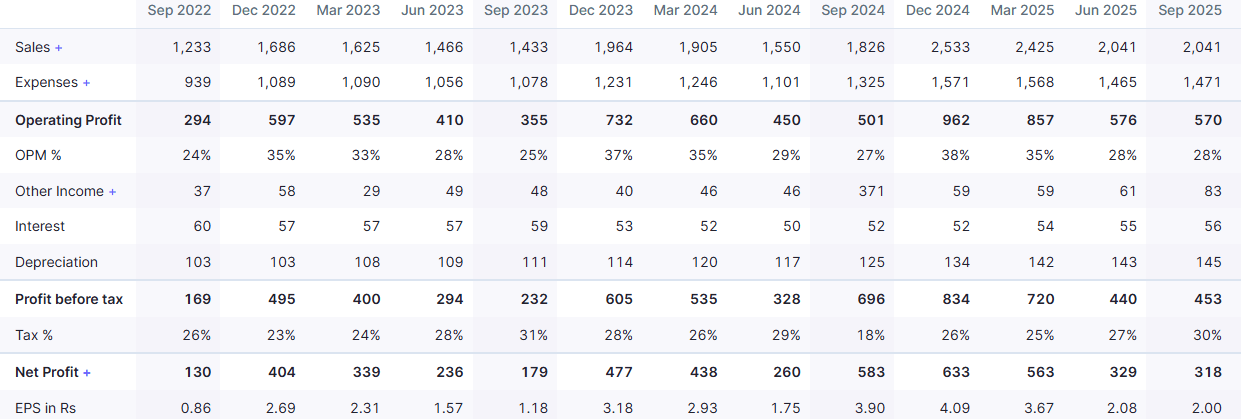
Titan’s quarterly numbers show a clear seasonal curve, with revenue usually building through September before peaking in the December quarter. Take a look at the chart below:
Titan Company Historical Quarterly Data
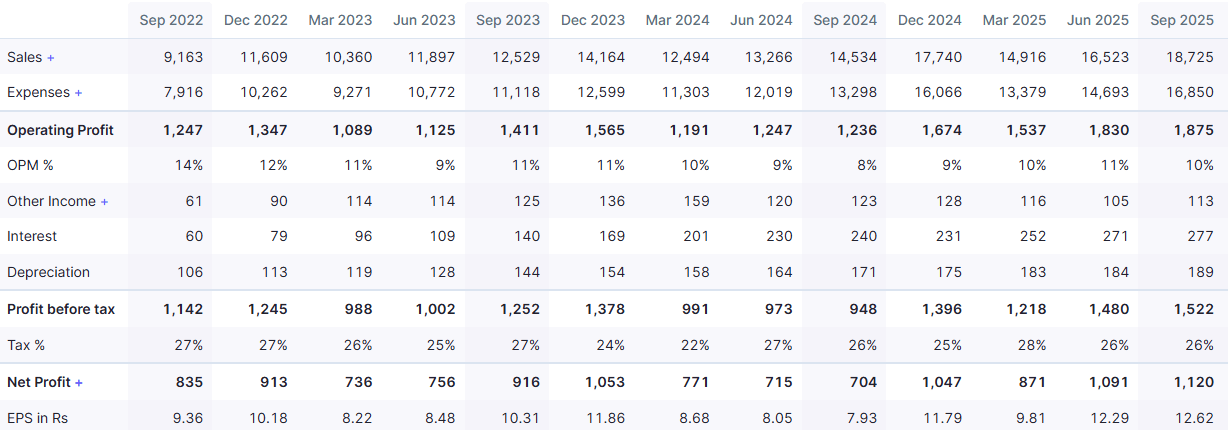
The pattern is visible in the company’s recent results, where Q2 reflects an early rise in festive and wedding-linked buying, while Q3 captures the full impact of year-end ceremonies. The September quarter often benefits from families beginning their gold purchases earlier, especially when weddings fall close to Diwali.
This year followed a similar trend. Management noted that buyers returned once gold prices stabilised and that many customers advanced purchases ahead of the wedding rush. Lighter-weight designs and lower-carat offerings helped draw younger shoppers, while the company’s gold-exchange program encouraged higher-ticket upgrades.
Wedding coins and bullion also saw strong traction as families stocked up before peak events. Titan expects the momentum to hold through the main wedding weeks, with post-Diwali sales tracking well and store expansion supporting demand across key markets.
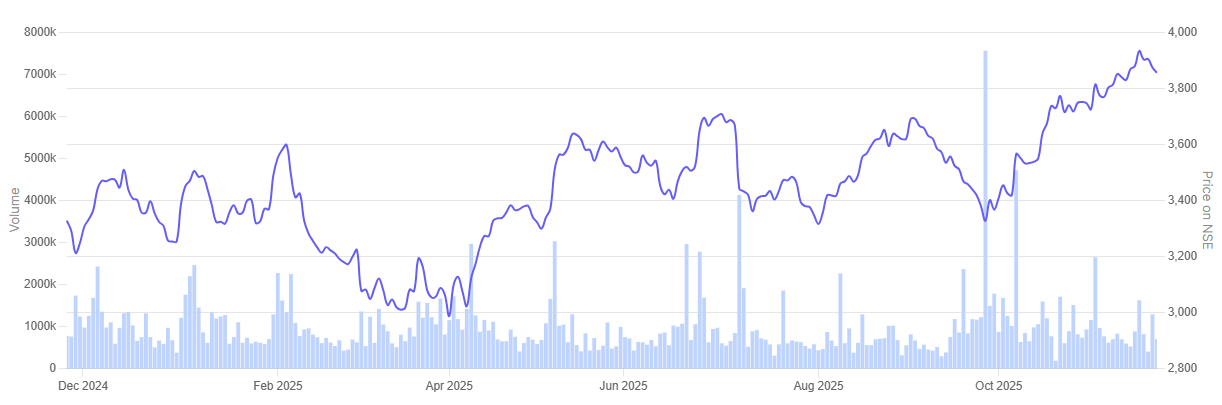
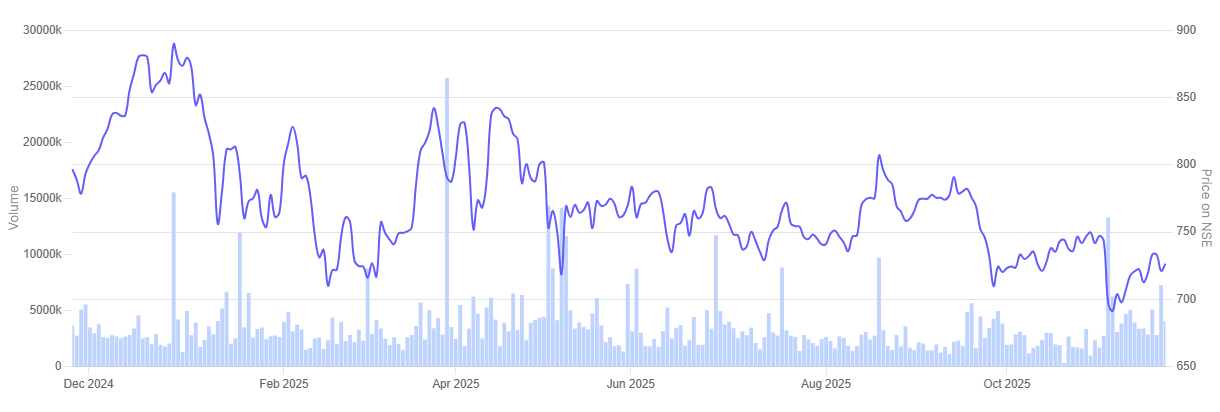
In the past one-year Titan Company share price has rallied 15.6%.
Titan Company 1 Year Share Price Chart
#2 Vedant Fashions: Dressing the Groom (and the Portfolio)
Vedant Fashions caters to the Indian celebration wear market with a diverse portfolio of brands. The company offers its customers a one-stop destination for every celebratory occasion and the largest men’s Indian wedding and celebration wear by revenue.
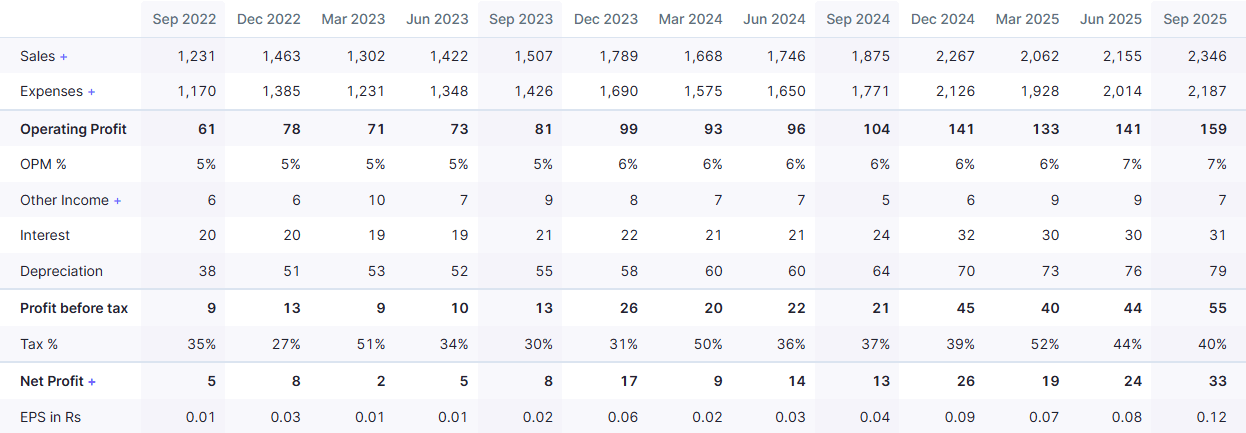
Vedant Fashions’ quarterly trend shows a familiar seasonal rhythm, with business typically building through September and reaching its strongest phase in the December quarter. Take a look at the chart below:
Vedant Fashions Historical Quarterly Data
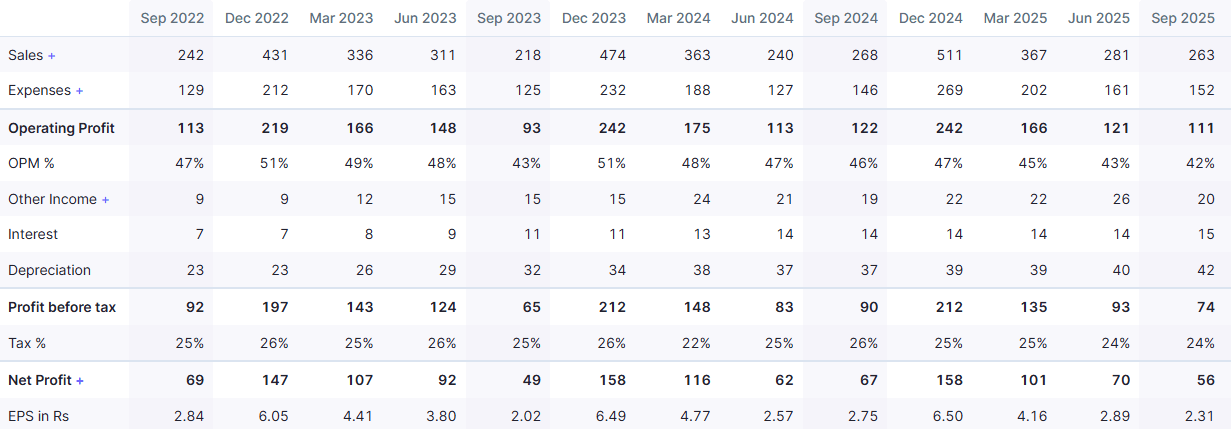
The second quarter often reflects early festive and wedding shopping, while the heavier wedding rush normally lifts Q3.
This year, the September quarter carried an additional layer of disruption because of GST rate changes, which briefly slowed dispatches and pulled down reported revenue. Secondary sales, however, remained stable as stores saw early footfalls ahead of the peak wedding weeks.
Management said demand patterns remain linked to wedding dates, with men usually buying 10–15 days before ceremonies and women purchasing a month or more in advance. Marketing campaigns across Manyavar, Mohey and Twamev helped improve visibility before the main season.
The company also continued to refresh stores and add select locations, including new outlets overseas. Vedant expects momentum to shift to Q3 as the bulk of wedding purchases and festive wardrobe planning typically fall into the December quarter.
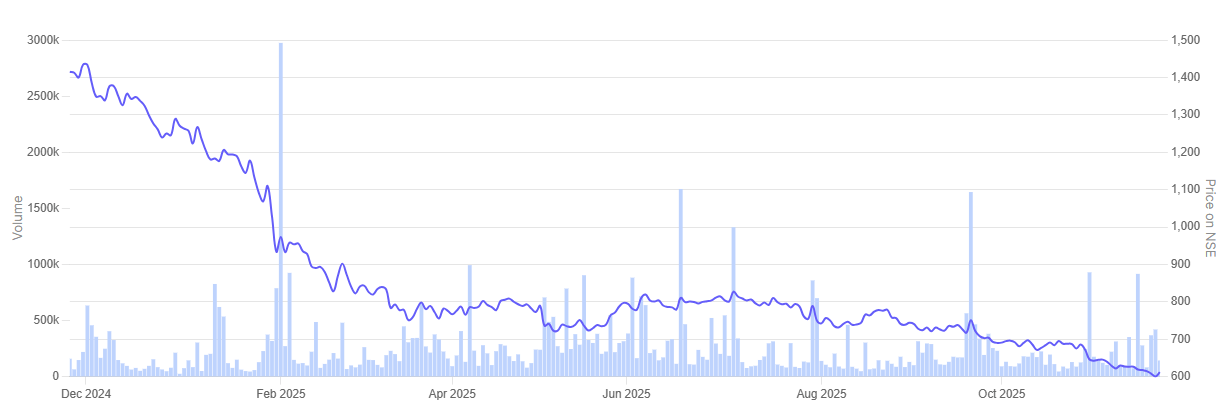
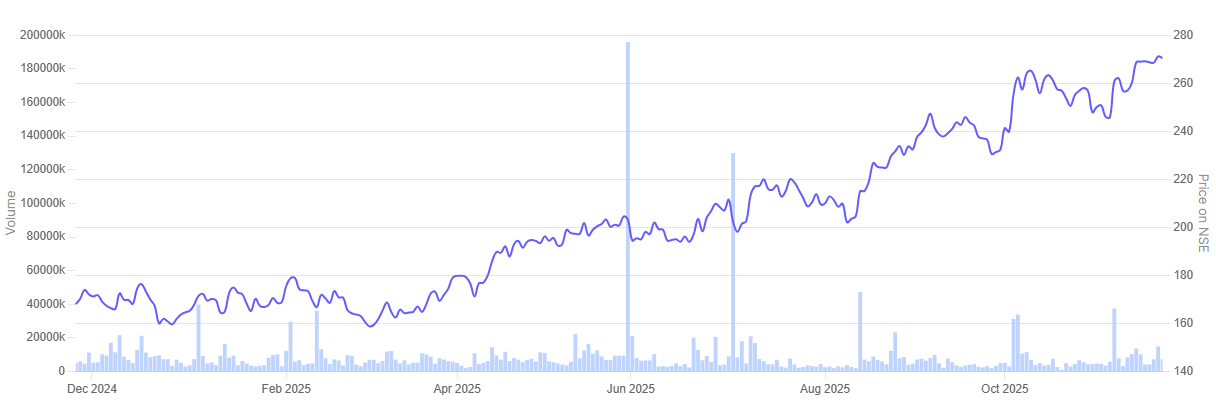
In the past one-year Vedant Fashions share price has tumbled 56.2%.
Vedant Fashions 1 Year Share Price Chart
#3 Indian Hotels: The “Destination Wedding” Play
Indian Hotels Company (IHCL), also Tata group company, is one of India’s leading hospitality companies. IHCL and its subsidiaries comprise diversified portfolio across luxury, upscale/upper upscale and lean luxury/midscale segments.
IHCL’s quarterly pattern shows a steady build-up through September before activity strengthens sharply in the December quarter. Take a look at the chart below:
Indian Hotels Company Historical Quarterly Data
The September period typically captures conference traffic, early leisure travel and advance wedding bookings, while the heavy wedding rush later in the year lifts Q3. This year, the company also dealt with temporary room closures due to large renovation projects, which softened reported growth even as underlying demand stayed firm.
Management said bookings for November and December 2025 remain strong, helped by a busy wedding calendar, corporate travel and multiple high-profile events. Renovated rooms at key properties such as Taj Palace and other metro hotels are now back in operation, giving the company more inventory for the peak winter season.
IHCL also added new hotels and continued to scale its management contract portfolio, which carries high-margin fee income. Executives expect Q3 and Q4 to show double-digit revenue growth, supported by stable demand, limited new supply and strong business on the books.
In the past one-year Indian Hotels Company share price has declined 9%.
Indian Hotels Company 1 Year Share Price Chart
#4 Nykaa: The “Lipstick Effect” Meets Wedding Glamour
FSN E-commerce Ventures (FSNEV) popularly known as “Nykaa” is a digitally native consumer technology platform, delivering a content-led, lifestyle retail experience to consumers. The company has a diverse portfolio of beauty, personal care, and fashion products, including owned brand products manufactured by it.
Nykaa’s quarterly trend shows a steady climb through September before activity peaks in the December quarter, when festive and wedding-linked demand is at its strongest. Take a look at the chart below:
FSN E-Commerce Historical Quarterly Data
The September period often captures early beauty and fashion purchases as families begin preparing for weddings, while Q3 benefits from the surge driven by Pink Friday sales and peak matrimonial dates. You can see this same pattern playing out again in the most recent quarter. Even though it’s usually a slower time of year, a surge in customers and more activity on the platform really boosted results.
Management pointed out that the total value of beauty products sold jumped 28% compared to last year in the second quarter of fiscal year 2026. This was thanks to new partnerships with international brands and a significant increase in sales of high-end items. Fashion is also getting back on track, with new brands and platform upgrades drawing in shoppers for the first time.
On top of that, Nykaa opened 19 more beauty stores and launched in eight new cities. Executives expect Q3 to remain the strongest quarter as festive momentum flows into wedding purchases and rapid-delivery formats drive higher conversion.
In the past one-year FSN E-commerce Ventures share price has jumped 61%.
FSN E-commerce Ventures 1 Year Share Price Chart
Valuations
Let’s now turn to the valuations of the wedding season beneficiaries in focus, using the Enterprise Value to EBITDA multiple as a yardstick.
Wedding Season Beneficiary Stocks in India
| Sr No | Company | EV/EBITDA | Respective Industry EV/EBITDA Median | ROCE |
| 1 | Titan Company | 48.0 | 16.6 | 19.1% |
| 2 | Vedant Fashions | 38.6 | 15.1 | 25.9% |
| 3 | Indian Hotels Company | 33.0 | 17.5 | 17.2% |
| 4 | FSN E-Commerce | 129.7 | 12.5 | 9.6% |
The valuation picture for these wedding-season beneficiaries shows a clear pattern. All four companies trade well above the EV/EBITDA medians of their respective industries, and the gap is not small. This is partly the result of a steady re-rating in consumer and hospitality names over the last few years, helped by strong balance sheets and better demand visibility.
The numbers make the premium obvious. The jewellery major trades at 48x versus an industry median of 16.6x. The ethnic fashion leader sits at 38.6x against 15.1x. A large hotel chain commands 33x compared with 17.5x. And the beauty and fashion platform carries a very rich multiple of 129.7x, far above the sector median of 12.5x.
Return ratios show a mixed picture. The apparel company delivers the strongest Return on Capital Employed (ROCE), while jewellery and hotels follow with solid numbers. The online platform is lower, with a single-digit return profile. This combination of high multiples and uneven return metrics suggests that investors are pricing in several years of growth upfront.
That brings the discussion back to valuations. These are strong businesses in categories that continue to benefit from weddings and festive spending. But with such elevated multiples, the key question is whether there is still enough room for meaningful upside — or whether a large part of the future story is already reflected in current prices.
Conclusion
The wedding market may be riding a wave this season, but the listed universe that benefits from it is small and very specific. Jewellery, ethnic wear, hotels and beauty retail clearly feel the lift when lakhs of families prepare for ceremonies at the same time. Their quarterly numbers and store activity already show how much of this demand arrives ahead of the main wedding weeks.
At the same time, valuations across these names are no longer modest. A lot of these companies are trading way higher than the average for their industries. This basically means the market’s already expecting good things from them. While having solid brands and consistent customer interest helps, when prices get this high, it’s always a good idea to dig a little deeper.
For investors, the takeaway is simple. The wedding boom does create opportunities, but every company has its own set of risks, return metrics and growth assumptions built into the price. It’s worth taking the time to examine these factors carefully before making any investment decision.
Disclaimer:
Note: We have relied on data from www.Screener.in throughout this article. Only in cases where the data was not available, have we used an alternate, but widely used and accepted source of information.
The purpose of this article is only to share interesting charts, data points and thought-provoking opinions. It is NOT a recommendation. If you wish to consider an investment, you are strongly advised to consult your advisor. This article is strictly for educative purposes only.
Ekta Sonecha Desai has a passion for writing and a deep interest in the equity markets. Combined with an analytical approach, she likes to dig deep into the world of companies, studying their performance, and uncovering insights that bring value to her readers.
Disclosure: The writer and her dependents do not hold the stocks discussed in this article.
The website managers, its employee(s), and contributors/writers/authors of articles have or may have an outstanding buy or sell position or holding in the securities, options on securities or other related investments of issuers and/or companies discussed therein. The content of the articles and the interpretation of data are solely the personal views of the contributors/ writers/authors. Investors must make their own investment decisions based on their specific objectives, resources and only after consulting such independent advisors as may be necessary.