

By Ekta Sonecha Desai
The Indian stock market has taken a brutal beating. In just one day on 27 January 2025, the Sensex didn’t just fall—it crashed, tumbling over 800 points in a single session and erasing nearly ₹10 lakh crore in investor wealth. Panic swept through Dalal Street as traders watched their screens turn an unforgiving shade of red. Blue-chip stocks bled. Mid-caps and small-caps suffered deeper cuts.
What’s fueling this chaos? A perfect storm of uncertainty. Weak corporate earnings have shaken investor confidence. Foreign institutional investors (FIIs) are pulling out their money, spooked by global volatility. Interest rates remain high, tightening liquidity. Geopolitical tensions, inflation concerns, and a cautious outlook on India’s growth have added to the fear. The once-roaring market, which seemed unstoppable just months ago, now feels fragile and exposed.
Not surprisingly, some of the worst hit stocks have been the ones with lofty valuations. Having said that, even after this fall, there are stocks that continue to defy gravity, trading at jaw-dropping valuations as if the market turmoil doesn’t exist. Their Price-to-Earnings (P/E) ratios remain sky-high. Investors are left wondering—are these stocks truly worth their price, or is this another bubble on the verge of bursting?
As Warren Buffett wisely said, “Price is what you pay. Value is what you get.” A stock’s price can be deceiving. Just because it’s expensive doesn’t mean it’s valuable. Investors must look deeper and assess what they’re actually getting in return.
One of the most widely used tools for this is the P/E ratio. It’s a simple yet powerful metric that helps determine whether a stock is overpriced or fairly valued. The formula is straightforward:
P/E Ratio = Market Price per Share / Earnings per Share
A high P/E suggests that investors expect strong future growth. A low P/E could mean the stock is undervalued—or that trouble is brewing.
Let’s take a look at three Indian stocks that are still trading at high P/E ratios despite the market downturn.
Devyani International is the largest franchisee of Yum Brands in India and is among the largest operators of chain quick service restaurants (QSR) in India. In addition, the company is a franchisee for the Costa Coffee brand and stores in India.
Popular brands like KFC, Pizza Hut, Taco Bell, operate under the umbrella of Yum Brands.
Devyani International is currently trading at a staggering P/E ratio of 1,341.3 times and a PEG ratio of 65.8 times.
Devyani International’s lofty valuation raises an important question—is the market pricing in future growth, or is the stock simply overvalued? A closer look at its financial performance may provide some answers.
Over the last five years, Devyani has demonstrated strong revenue growth, with sales climbing from Rs 1,516 crore in 2020 to Rs 3,556 crore in 2024, reflecting a 23.8% CAGR. This momentum was largely driven by aggressive store expansions and an increasing appetite for quick-service dining.
Profitability also followed an upward trajectory, with operating profit rising from Rs 262 crore in 2020 to Rs 654 crore in 2024. Strategic initiatives, including menu optimisation, better cost controls, and improved supply chain management, contributed to this growth.
However, despite this progress, net profit took a hit in 2024. After turning positive in 2022 and peaking at Rs 263 crore in 2023, the company slipped into a Rs 10 crore loss in 2024. This decline wasn’t due to weak fundamentals but rather one-time expansion costs and higher marketing spend to boost brand visibility. This in turn is partly responsible for the very high P/E.
Devyani International’s Financial Performance Summary (2020-24)
| Particulars | FY20 | FY21 | FY22 | FY23 | FY24 |
| Sales (Rs in crore) | 1,516 | 1,135 | 2,084 | 2,998 | 3,556 |
| Operating Profit (Rs in crore) | 262 | 189 | 476 | 657 | 654 |
| Net Profit (Rs in crore) | -121 | -63 | 155 | 263 | -10 |
| EPS (Rs) | -11.5 | -0.5 | 1.3 | 2.2 | 0.4 |
Source: Screener.in
Let’s analyse Devyani International’s EPS performance over the past five years alongside its P/E ratio trends during the same period.
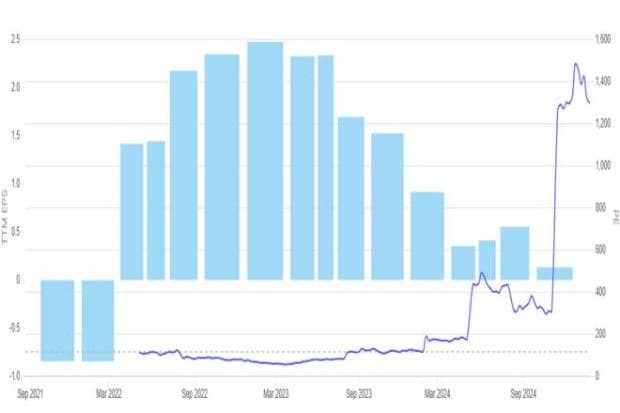
Devyani International P/E Ratio and EPS Comparision (2020-2024)
Source: Screener.in
The graph of the five-year P/E ratio for Devyani International is revealing in its pattern. While EPS of the company (blue bars) went up consecutively between 2022 and early 2023, there was a dramatic fall starting in late 2023, meaning that earnings began to decline. Meanwhile, P/E ratio (blue line) started rising in a manner never witnessed before in mid-2024, breaching 1,400—levels much beyond the historical median P/E of 117.1.
This sharp divergence between deteriorating earnings and soaring valuations suggests that current investor expectations may be driven by forward-looking growth prospects, and a return to profitability, rather than the trailing financial performance.
Such a disconnection raises concerns over whether these high multiples are sustainable, especially given the volatile earnings trajectory. The high premium on the stock reflects either a strong belief over long-term potential or an overvaluation driven by market optimism.
#2 Aditya Birla Real Estate
The journey of Aditya Birla Real Estate began in 1897 as a single-unit textile manufacturing entity under Century Textiles and Industries (CTIL). Over the decades, CTIL diversified into pulp & paper, cement, and real estate, launching Birla Estates in 2016 to mark its entry into residential and commercial real estate.
In March 2024, CTIL discontinued most of its textile operations at the Birla Century Plant in Jhagadia, Gujarat, due to operational losses and an inability to secure viable orders. Only minor manufacturing activities continue to support Birla Advanced Knits, a joint venture with Grasim Industries.
Recognizing the growth potential in real estate, CTIL rebranded itself as Aditya Birla Real Estate in 2024, focusing solely on real estate and pulp & paper, solidifying its leadership in these sectors.[RG1]
The company is currently trading at P/E ratio of 1,218.7 times.
A B Real Estates’ premium valuations bring up a critical question — are these achievements a reflection of genuine long-term potential, or is the brand riding on the legacy of the Aditya Birla Group? A dive into financial performance could shed some light.
The company’s financial performance has fluctuated across key metrics over the last five years.
Sales revenue increased from ₹3,423 crore in FY20 to ₹4,514 crore in FY24, which is a 5.8% CAGR. Sales increased due to strong demand in the real estate segment and successful launch of premium projects.
Operating profit rose to ₹639 crore in FY24, up from ₹550 crore in FY20. Cost savings was the major reason behind increases as operational efficiencies improved.
Net profit, however, has been volatile and declined from ₹360 crore in FY20 to ₹60 crore in FY24. Its net profit declined because of the discontinuation of operations and remeasurement of certain assets at their net realizable value.
These financial trends reveal growth in revenue but difficulties in sustaining profitability, primarily because of cost pressures and restructuring efforts in some divisions.
Aditya Birla Real Estate’s Financial Performance Summary (2020-24)
| Particulars | FY20 | FY21 | FY22 | FY23 | FY24 |
| Sales (Rs in crore) | 3,423 | 2,617 | 4,131 | 3,832 | 4,514 |
| Operating Profit (Rs in crore) | 550 | 205 | 444 | 567 | 639 |
| Net Profit (Rs in crore) | 360 | -34 | 162 | 265 | 60 |
| EPS (Rs) | 32.7 | -2.7 | 14.9 | 24.3 | 4.5 |
Source: Screener.in
Let’s analyse Aditya Birla Real Estate’s EPS performance over the past five years alongside its P/E ratio trends during the same period.
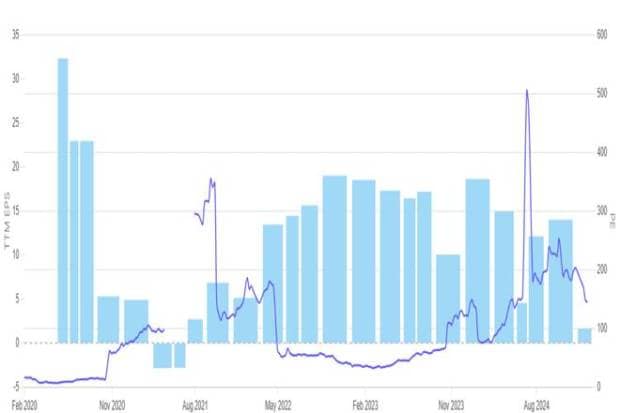
Aditya Birla Real Estate’s P/E Ratio and EPS Comparision (2020-2024)
Source: Screener.in
The P/E ratio chart of Aditya Birla Real Estate has shown considerable fluctuations over the last five years. During this period, the EPS (blue bars) had shown sharp variations, including negative performances, while the P/E ratio (blue line) had shown dramatic spikes.
In early 2024, the P/E ratio soared above 500, indicating an overvaluation relative to earnings. This surge occurred despite only marginal improvement in EPS, possibly suggesting heightened market expectations for future growth rather than immediate performance. However, as EPS declined later, the P/E ratio began stabilising but remained elevated compared to historical levels.
Such trends indicate that investors are optimistic about long-term prospects, but the gap between earnings and valuation raises questions about sustainability. This scenario calls for caution on the part of investors because the high P/E reflects speculative growth rather than consistent financial performance.
#3 FSN E-Commerce Ventures
FSN E-commerce Ventures (FSNEV) popularly known as Nykaa is a digitally native consumer technology platform, delivering a content-led, lifestyle retail experience to consumers. The company has a diverse portfolio of beauty, personal care, and fashion products, including owned brand products manufactured by it.
Nykaa’s current P/E ratio stands at 1,126.9 times, while its PEG ratio is 41.6 times.
FSN E-Commerce’s steep valuations prompt a key question—are these figures justified by robust future growth, or is the stock inflated by market enthusiasm? A closer look at its financial performance may offer some answers.
Over the last five years, FSN E-Commerce Ventures has demonstrated significant financial growth. Sales rose from ₹1,768 crore in FY20 to ₹6,386 crore in FY24, with a CAGR of 29.3%. The rise was driven by an expansion in product categories, a growing customer base, and an increase in average order values across key business segments.
Operating profit improved from ₹83 crore in FY20 to ₹347 crore in FY24. This was largely due to optimized fulfillment costs, reduced marketing-to-sales ratios, and better customer retention, which resulted in higher operating efficiencies.
Net profit showed fluctuations, beginning with a loss of ₹16 crore in FY20 and reaching ₹40 crore in FY24. The improvement was supported by operating leverage and enhanced unit economics in key verticals, although depreciation and finance costs remained high.
This analysis reflects robust growth in revenue and operational metrics, alongside efforts to improve profitability.
FSN E-Commerce Financial Performance Summary (2020-24)
| Particulars | FY20 | FY21 | FY22 | FY23 | FY24 |
| Sales (Rs in crore) | 1,768 | 2,441 | 3,774 | 5,144 | 6,386 |
| Operating Profit (Rs in crore) | 83 | 158 | 164 | 257 | 347 |
| Net Profit (Rs in crore) | -16 | 62 | 41 | 21 | 40 |
| EPS (Rs) | -1.9 | 6.8 | 0.1 | 0.1 | 0.1 |
Source: Screener.in
Let’s analyse FSN E-Commerce’s EPS performance over the past five years alongside its P/E ratio trends during the same period.
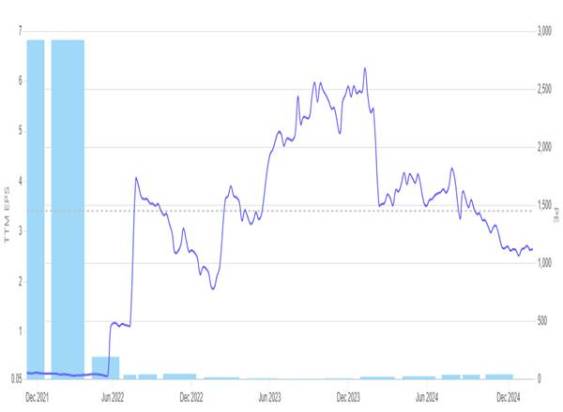
FSN E-Commerce’s P/E Ratio and EPS Comparision (2020-2024)
Source: Screener.in
The P/E ratio chart of FSN E-Commerce reveals significant volatility over time. The company’s EPS (blue bars) showed an initial rise but later stabilised at lower levels, indicating inconsistent earnings growth. Despite these fluctuations, the P/E ratio (blue line) remained extremely elevated, surpassing 2,500 at one point in 2023, reflecting intense investor optimism.
As earnings flattened and market conditions evolved, the P/E ratio gradually declined, though it still remains high relative to traditional benchmarks. This trend highlights a potential disconnect between market expectations and the company’s actual earnings performance.
Such high valuations suggest that investors are pricing in significant future growth, but the declining P/E indicates a potential re-evaluation of these expectations.
Conclusion
While high P/E ratios can indicate investor confidence, they also warrant caution. A stock’s price must align with its underlying value over the long term. Blindly chasing such companies could expose investors to significant risks, especially if growth fails to meet expectations.
It is important to note that P/E ratios can sometimes appear optically high when companies are in a build-up phase or when they have a temporary drop off in profitability. Businesses investing heavily in expansion, marketing, or new product development may have temporarily suppressed earnings, which can distort valuation metrics. In such cases, a high P/E may not necessarily indicate overvaluation but rather future growth potential.
Investors must balance optimism with a careful evaluation of fundamentals. Analyzing metrics like revenue, profitability, and earnings growth is essential. It is equally important to keep an eye on broader market trends and company-specific challenges.
In the end, high valuations may be justified for some, but they can also signal speculative exuberance. A cautious, informed approach is key to navigating such opportunities in a volatile market.
Note: We have relied on data from www.Screener.in throughout this article. Only in cases where the data was not available, have we used an alternate, but widely used and accepted source of information.
The purpose of this article is only to share interesting charts, data points and thought-provoking opinions. It is NOT a recommendation. If you wish to consider an investment, you are strongly advised to consult your advisor. This article is strictly for educative purposes only.
Ekta Sonecha Desai has a passion for writing and a deep interest in the equity markets. Combined with an analytical approach, she likes to deep deep into the world of companies, studying their performance, and uncovering insights that bring value to her readers.
Disclosure: The writer and his dependents do not hold the stocks discussed in this article. The website managers, its employee(s), and contributors/writers/authors of articles have or may have an outstanding buy or sell position or holding in the securities, options on securities or other related investments of issuers and/or companies discussed therein. The content of the articles and the interpretation of data are solely the personal views of the contributors/ writers/authors. Investors must make their own investment decisions based on their specific objectives, resources and only after consulting such independent advisors as may be necessary