
By Rajesh Palviya
Nifty closed at 16705 with a gain of 255 points on a weekly basis. On the weekly chart, the index has formed a Bullish candle with a long lower shadow indicating buying at lower levels. The index is moving in a Higher Top and Higher Bottom formation on the weekly chart indicating a sustained uptrend.
The chart pattern suggests that if Nifty crosses and sustains above 16750 level it would witness buying which would lead the index towards 16800-17000 levels. However, if the index breaks below the 16500 level it would witness profit booking which would take the index towards 16300-16200. Nifty is trading above 20 and 50 day SMA’s which are important short-term moving averages, indicating positive bias in the short term. Nifty continues to remain in an uptrend in the medium term, so buying on dips continues to be our preferred strategy. For the week, we expect Nifty to trade in the range of 17000-16300 with a positive bias.
The weekly strength indicator RSI and momentum oscillator Stochastic have both are in bullish mode and are above their respective reference lines indicating positive bias.
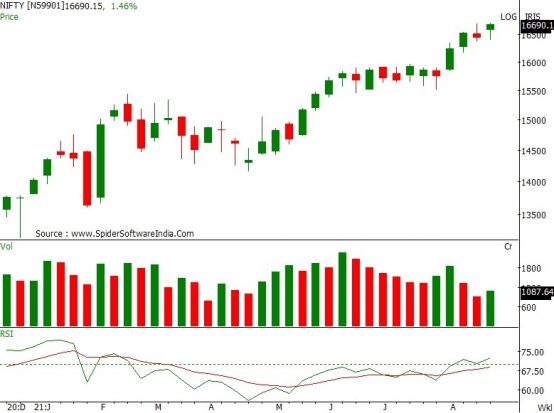
India VIX index is at 13.40 v/s 13.46. Nifty ATM call option IV is currently 9.18 whereas Nifty ATM put option IV is quoting at 12.48. Index options PCR is at 1.40 v/s 1.23 & F&O Total PCR is at 0.87.
Bank Nifty outlook
Bank Nifty started the week on flat note and buying momentum for most part of the week led it to close on a positive note. Bank Nifty closed at 35628 with a gain of 594 points on a weekly basis.
On the weekly chart the index has formed a small Bullish candle with shadows on either side indicating indecisiveness amongst participants regarding the direction. For the past three months, the index is consolidating within 36300-34000 levels indicating short term sideways trend. Hence any either side breakout will indicate further direction. The chart pattern suggests that if Bank Nifty crosses and sustains above 35800 level it would witness buying which would lead the index towards 36000-36500 levels. However, if index breaks below 35000 level it would witness selling which would take the index towards 34500-34000 levels.
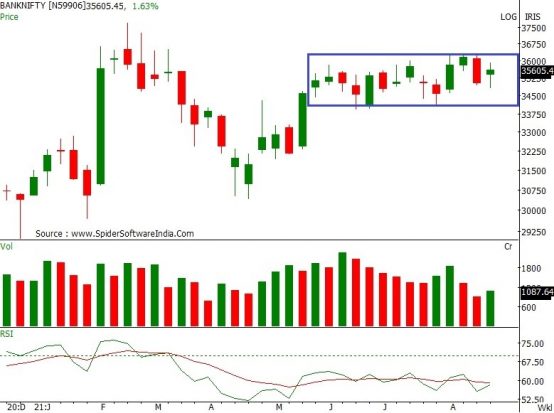
Bank Nifty is now well placed above its 50 and 100 SMA indicating positive bias in the short term. Bank Nifty continues to extend its sideways trend for short to medium term, hence any either side breakout will signal further direction. For the week, we expect Bank Nifty to trade in the range of 36300-34500 with a mixed bias.
The weekly strength indicator RSI and momentum oscillator Stochastic have both turned negative and are below their respective reference lines indicating negative bias.
Sectors and stocks to watch this week
We expect the IT, Capital Goods, Chemicals, FMCG and Cement sectors to do well in the near term. Stocks like Mindtree, Wipro, Tech Mahindra, Bata India, L&T, Siemens, ICICI Bank, Bajaj Finance, Reliance Industries Ltd (RIL), Navin Fluorine can do well in near term.
(Rajesh Palviya is Vice President– Research (Head Technical & Derivatives) at Axis Securities Limited. The views expressed are the author’s own. Please consult your financial advisor before investing.)