
")
Currency moves often look like a distant macro story, discussed by economists and global fund managers. Most investors spend their time watching stock prices move up and down. Some track indices. A few follow sectors. Rarely does someone pause and look at a currency chart and think – Can I take advantage of it for my long-term investments in India?
The falling Japanese Yen is one such story. It doesn’t come with excitement. There are no flashy headlines. But if you look closely, it has been playing a silent role in shaping the fortunes of some of India’s most respected auto companies.
And sometimes, silent trends are the most powerful ones.
The Japan Connection: Why the Yen Matters
The USDJPY simply tells us how many Yen it takes to buy one US Dollar. When this number goes up, the Yen is losing value.
A weaker Yen helped Japanese companies expand overseas, invest in manufacturing hubs, and build long-term partnerships. India became a natural destination.
Look at our auto sector. Maruti Suzuki is not just a company; it is almost a household name. Hero Moto Corp started its journey as Hero Honda. Add Toyota Kirloskar, Honda Cars India, Suzuki’s vendor ecosystem and the list goes on. These are not short-term collaborations. They are relationships built over decades.
The Signal: Reading the USDJPY Breakout
Before we get excited about stocks, it helps to respect the driver behind the story. Currency trends don’t change every year. They move slowly, sometimes painfully slow. But once they change direction, they tend to stay there for a long time.
That’s why the USDJPY chart deserves attention. Not for trading. Not for prediction. But for understanding the environment in which businesses operate.
USDJPY Monthly Chart
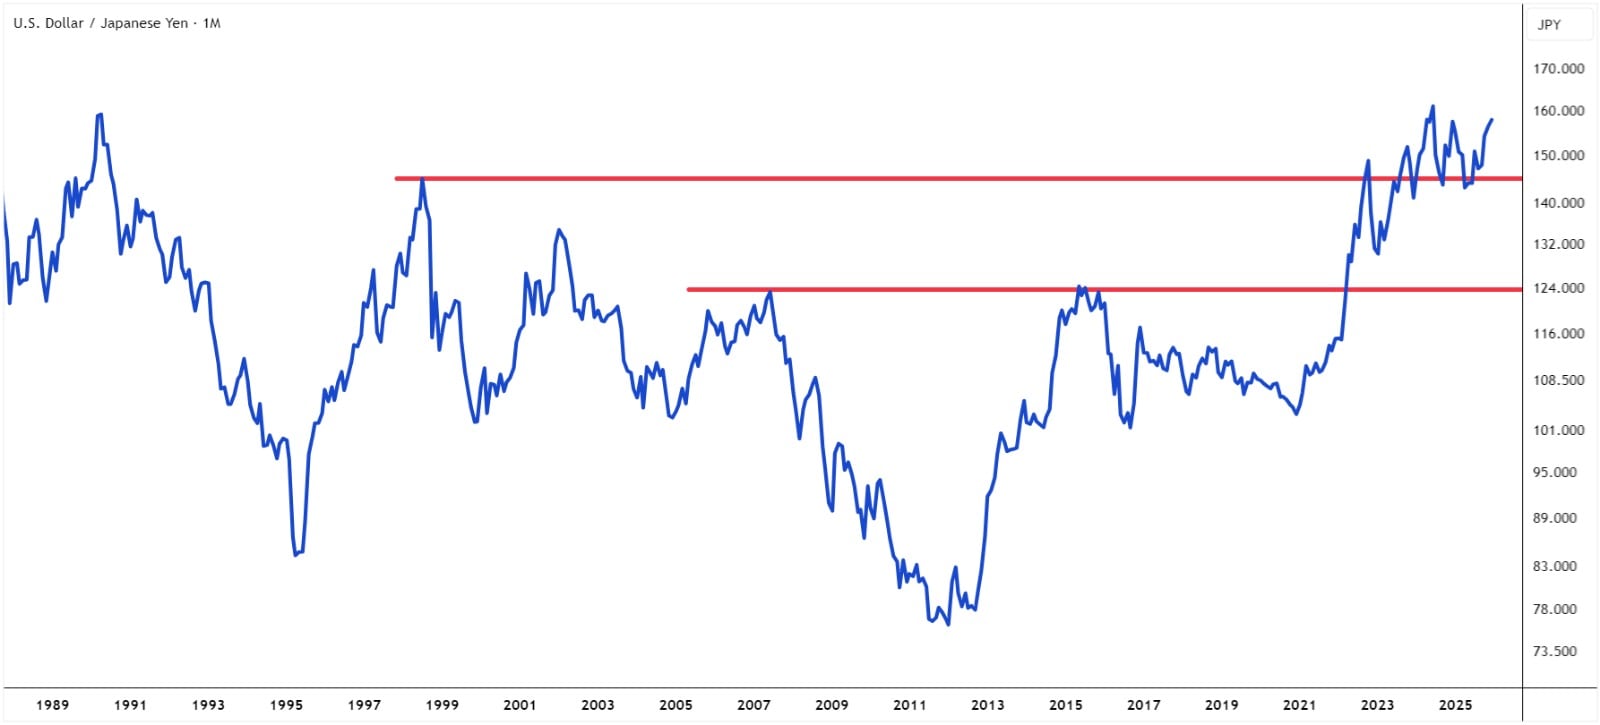
For many years after 1990, the Yen was relatively strong. The chart showed lower highs and lower lows. The entire structure broke in 2022 when USDJPY crossed its old 1990 highs.
This was no random spike; the move sustained. The currency crossed the 1998 highs and went all the way towards 160 in 2024. What followed was not a crash, but a pause. A consolidation. And then fresh attempts to move higher.
From a chartist’s point of view, this looks like a classic case of a long-term breakout followed by retesting and continuation. Nothing dramatic. Just steady weakness in the Yen.
The Mechanism: How a Weak Yen Boosts Margins
In simple words, a weak Yen makes Japanese-linked businesses more competitive globally. Overseas earnings look better when converted back. Costs related to technology, components, and royalties become easier to manage for partners outside Japan.
There are downsides too, of course. But companies with global operations often handle this phase better than most.
I am not an economist and do not make macro calls or comments on central banks or interest rate policies. Everything written here comes from observing charts and how markets have behaved historically. Nothing more.
How Does an Indian Investor Benefit?
Here’s where things get practical.
Companies like Maruti Suzuki and Hero MotoCorp have their Japanese partnerships influence product design, manufacturing efficiency, sourcing, and even cost structures. When the Yen weakens, these advantages quietly increase. (While Hero broke off its joint venture with Honda years ago, there are still some linkages with Japanese businesses).
Lower effective costs don’t show up as instant fireworks in quarterly results. But over time, they improve margins, strengthen balance sheets, and give management breathing room. In strong market phases, these companies run faster. In weak markets, they fall less.
That’s the real benefit. Not short-term excitement, but a long-term stability.
Maruti Suzuki: The Primary Beneficiary
If you go back and study Maruti Suzuki’s long-term chart alongside phases of Yen depreciation, a pattern becomes hard to ignore. Whenever USDJPY stayed in a sustained uptrend, Maruti rewarded patient investors.
USDJPY vs Maruti Chart
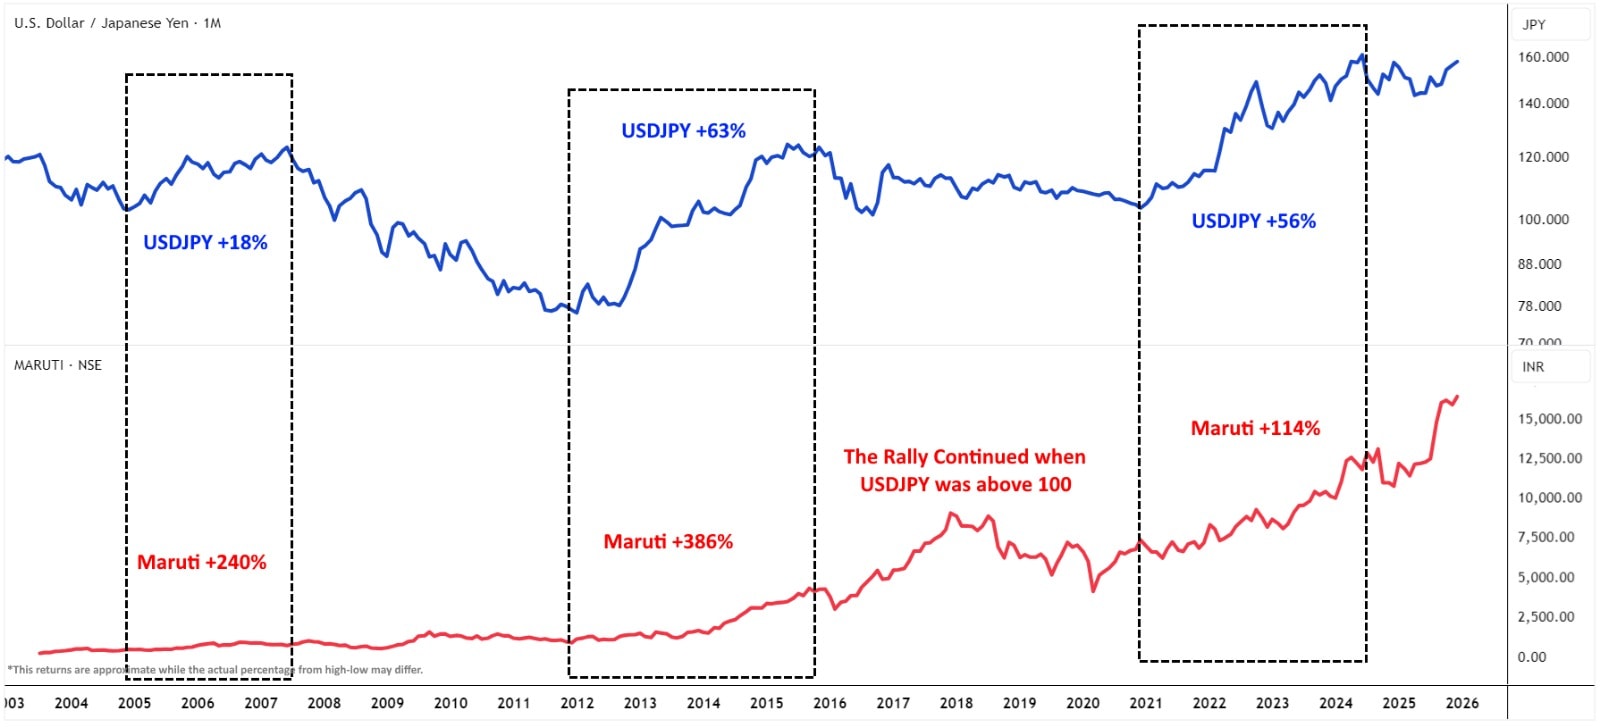
Not with small gains. With meaningful wealth creation. Over full cycles, returns crossed 100%. But these gains didn’t come overnight. They came slowly, through years of staying invested.
The broader Indian market always plays a role. But whenever USDJPY stayed above the 100 zone, Maruti found support again and again. The recent strong up move in 2025, with the Yen hovering near 150, fits neatly into this long-running pattern.
This is not a trader’s story. It is an investor story.
Hero MotoCorp: Riding the Sector Tailwind
Hero MotoCorp may operate in a different segment, but the currency impact is similar. Japanese technology has been central to its journey (even though its JV with Honda ended years ago). And during phases when the Yen weakened, Hero’s stock performance reflected that advantage.
USDJPY vs Hero Moto Corp Chart
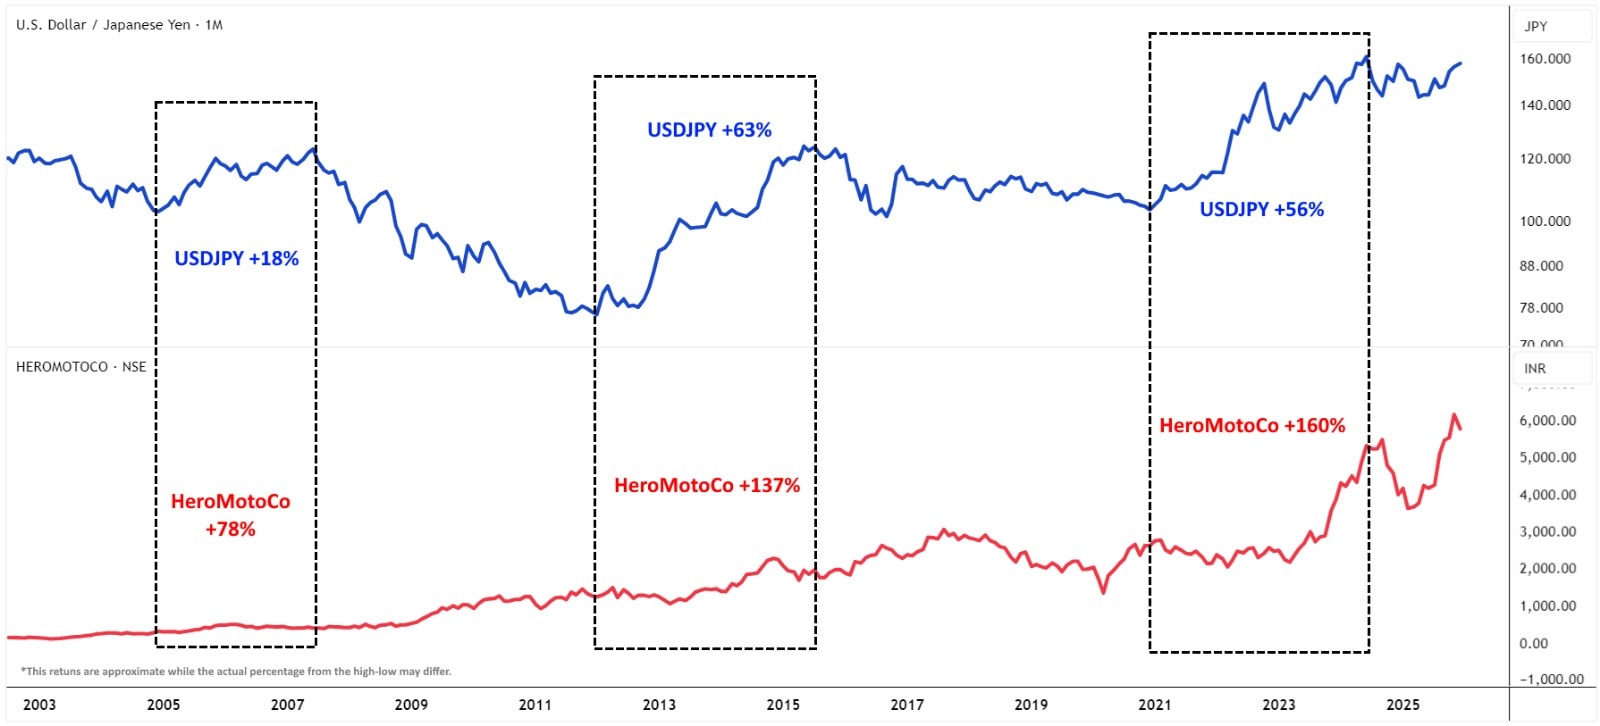
Margins stayed steady. Trends remained bullish. Even now, with USDJPY around the 150 area, the stock continues to hold its ground and rising. It’s not loud. It’s not flashy. But it is steady.
Sometimes, that’s all an investor needs.
What If USDJPY Moves Above 160 Again?
If the Yen weakens further and USDJPY moves decisively above 160, it would only confirm the ongoing trend. From a chart perspective, that would not be surprising.
Will Indian stocks correct in between? Of course. Markets always do. But if the currency tailwind remains, those corrections may turn into accumulation zones rather than panic points, especially for stocks already in long-term uptrends.
Boring on the Surface, Powerful Beneath
Good investment ideas don’t always arrive with noise. Some arrive quietly, through currency charts, long-term relationships, and patterns that repeat over decades.
The falling Yen is one such idea. And for Indian investors willing to look beyond daily price moves, it may continue to quietly support two of India’s most trusted auto names.
Note: The purpose of this article is only to share interesting charts, data points and thought-provoking opinions. It is NOT a recommendation. If you wish to consider an investment, you are strongly advised to consult your advisor. This article is strictly for educative purposes only.
Brijesh Bhatia is an Independent Research Analyst and is engaged in offering research and recommendation services with SEBI RA Number – INH000022075. He has two decades of experience in India’s financial markets as a trader and technical analyst.
Disclosure: The writer and his dependents do not hold the stocks discussed here.
The website managers, its employee(s), and contributors/writers/authors of articles have or may have an outstanding buy or sell position or holding in the securities, options on securities or other related investments of issuers and/or companies discussed therein. The content of the articles and the interpretation of data are solely the personal views of the contributors/ writers/authors. Investors must make their own investment decisions based on their specific objectives and resources, and only after consulting such independent advisors if necessary.