
The Indian pharmaceutical industry has always played a pivotal role in the global healthcare industry. While India has always been known for its generic medicines and it is the largest producer and supplier of the same globally, now it also has a significant hold in other aspects of the pharma sector, such as Active Pharmaceutical Ingredients (APIs). In this space, India holds a market share of around 8% globally, both in terms of value of volume. (Source: IBEF)
The pharma companies that have delivered exceptional returns over the last five years are all into the manufacturing of APIs. Now that’s interesting, isn’t it?
We have shortlisted the top three pharma companies that delivered the highest 5-year average Return on capital employed (ROCE). At the top of the list is a company that delivered a whopping 53.4% ROCE.
So, let’s try to understand whether it is the shift towards manufacturing of APIs that helped these companies deliver constant growth, or if something else is fueling the growth.
#1 Gujarat Themis Biosyn Limited (GUJTHEM)
Gujarat Themis Biosyn Ltd. is another API developer in India, but what makes them different from other API manufacturing companies is that the company, Gujarat Themis, deals in fermentation-based intermediate manufacturing. There are not many players in the market who deal in fermentation-based intermediate production, which gives an edge to Gujarat Themis as well.
Star Product – Rifamycin
Gujarat Themis is the first pharma company in the country that started commercial production of the Antituberculosis drug Rifampicin. Today, the main business of the company comes from developing Rifamycin, the key intermediate required in the production of this drug.There are two variants that the company produces –
- Rifamycin S
- Rifamycin 0
The fungible capacity of these two products is up to 16,000 Kg per month.
Expansion Plans
The company is now looking for opportunities in the export market and has also started another API facility in Q1FY26 to raise its production capacity.
It is not only manufacturing, but they are continuously investing in R&D, and a new R&D facility is under construction for developing new products and increasing the application of the current ones.
Niche Product Driving Business
So, it is perhaps the niche product development that has worked in favor of the company. The company has delivered an average 5-year ROCE of 53.4% which is almost 4x the industry median of 16.9%.
Coming to the financials, sales of the company went up from ₹85 crore in FY20 to ₹151 crore in FY25, registering a 12% CAGR. Similarly, the profit rose from ₹24 crore to ₹49 crore during the period, growing at a 16% CAGR.
Valuation
The stock of Gujarat Themis is trading at a PE of 113.8x, which is way higher than the industry median of 33x, indicating a premium valuation.
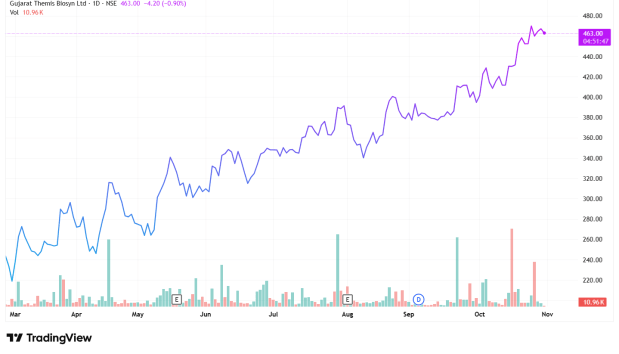
Share Price Chart of Gujarat Themis Biosyn Ltd. (Since Listing Date of 25 Feb 2025)
#2 Alivus Life Sciences Limited (ALIVUS)
Alivus Life Sciences Ltd. is the new name of one of the biggest pharma players, Glenmark Life Sciences (GLS). GLS was spun off from Glenmark Pharma in 2019. The company is focused on developing APIs. In March 2024, the company changed its name to Alivus Life Sciences Ltd.
Alivus is a leading developer and manufacturer of select APIs that are of high value and non-commoditized. These APIs are developed for different chronic therapeutic areas. The company also operates in the Contract Development and Manufacturing Operations (CDMO) space; however, that only contributes to around 5% of the total business.
Research & Development Fueling Rapid Growth
Currently, Alivus has a portfolio of 161 APIs, and it supplies more than 700 pharma companies across the globe. It is all due to their continuous input into the R&D, which helps them develop a wide number of pharmaceutical substances that are used across the pharma industry.
The company’s R&D spend has gone up continuously both in terms of amount and percentage of revenue. In FY22, Alivus dedicated 2.7% of its revenue, that is ₹57.2 crore, for R&D, which in FY25 rose to ₹80.5 crore, which is 3.4% of revenue.
This has resulted in the filing of 569 Drug Master Files (DMF) and Certificate of Suitability (CEP) globally as of June 2025. The HP API portfolio is also developing further with 26 new products in the pipeline, which have a market size of around ₹6,100 crore.
Coming to the R&D infrastructure, the company has separate infrastructure for new product development and complex molecules, and high-end analytical equipment for characterization in Mahape, Navi Mumbai. Then, for oncology R&D, the company has a facility at Dahej, Gujarat.
State-of-the-art Manufacturing Facilities
Another factor that perhaps helped the company grow is its state-of-the-art manufacturing facilities. Currently, they have 4 manufacturing facilities –
- Ankleshwar in Gujarat – Annual Installed Capacity is 950.2 KL
- Dahej in Gujarat – Annual Installed Capacity is 399.9 KL
- Mohol in Maharashtra – Annual Installed Capacity is 49.1 KL
- Kurkumbh in Maharashtra – Annual Installed Capacity is 24.6 KL
The company is further expanding its capacity, and a manufacturing facility is under construction at Solapur. Phase 1 of the construction is now on, which can boost the capacity by 200 KL. Both the facilities at Dahej and Ankleshwar are also expanding, which cumulatively can increase the capacity by 260 KL by the end of FY26.
The total capacity at the end of FY25 was 1,424 KL, which is anticipated to go up to 2,690 KL by FY28.
Continuous Financial Growth
The company appears to be continuously striving to develop new products and explore new markets. This has helped the company offer an average 5-year ROCE of 44.4% while the industry median is just 16.9%.
Coming to the finances, since FY20, the sales have gone up from ₹1,537 crore to ₹2,387 crore, growing at a compound annual growth rate (CAGR) of 9%. The profit also surged at a 9% CAGR for the period from ₹313 crore to ₹486 crore.
Valuation
The stock is trading at a price/earnings (PE) of 22.5x, which is lower than the industry median of 33.1x, indicating a relatively cheap valuation.
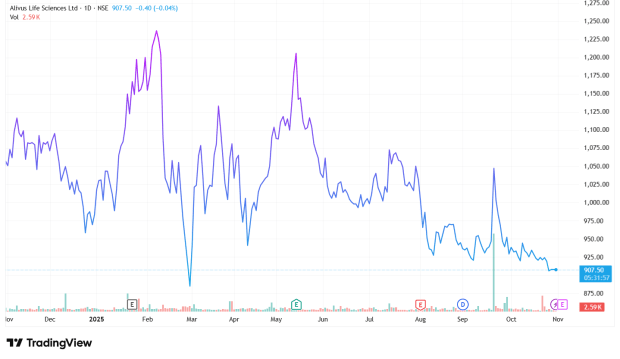
1 Year Share Price Chart of Alivus Life Sciences Ltd.
#3 Blue Jet Healthcare Limited (BLUEJET)
Blue Jet Healthcare Ltd. is another niche pharma product developer that first manufactured Saccharin and artificial sweeteners (saccharin salts) in India. However, its main business comes from contrast media intermediates, which are chemical agents used to enhance X-ray images, CT scans, MRIs, and USGs. The company supplies critical intermediates to the world leaders in contrast media manufacturing.
Apart from this, Blue Jet also deals in High-intensity sweeteners used in different pharma products as well as in food supplements, beverages, candies, toothpaste, and tabletop sweeteners, and others. It is also engaged in developing pharma intermediates and APIs for drugs that are used for treating chronic diseases.
Complex Chemistry is Blue Jet’s Forte
The Contrast Media intermediates market is highly concentrated, but what sets Blue Jet apart is its strategic focus on complex chemistry required for developing select contrast media intermediates. The company is a leader in exporting a select intermediate, which is 5-amino-N, N’-bis (2,3-dihydroxypropyl) Isophthalamide. Out of the total export of this intermediate from India, Blue Jet holds a 75% market share.
Long-term Relationship
As mentioned above, the contrast media market is highly concentrated, to the extent that only 4 major players hold 75% of the market cumulatively. Blue Jet supplied three of these four major contrast media manufacturers. The long-term steady growth of Blue Jet is due to its long-term association with these manufacturers, where contracts are of 4 years to even 26 years.
Steady growth over Half a Decade
The company has offered a 43.1% 5-year average ROCE, which is way higher compared to the industry median of 16.9%.
Coming to the financials,the sales went up from ₹538 crore in FY20 to ₹1,030 crore in FY25, growing at 14% CAGR. The profit during this period surged from ₹145 crore to ₹305 crore, growing at 16% CAGR.
Valuation
Blue Jet shares are trading at a PE of 31.9x, slightly below the industry median of 33.1x.
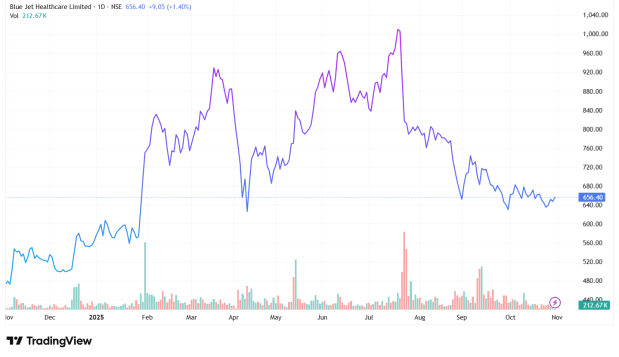
1-year share price chart of Blue Jet Healthcare Ltd.
Wrapping up
It is quite interesting to see that within the pharma industry, companies that are focused on developing and manufacturing APIs are ones that are delivering the higher growth. Even in highly concentrated markets, these companies are making their way in generating long-term revenues. This perhaps reflects the changing Indian pharmaceutical landscape from being the largest generic drug supplier to a hub for innovation-led API manufacturing.
We have relied on data from www.Screener.in throughout this article. Only in cases where the data was not available, have we used an alternate, but widely used and accepted source of information.
The purpose of this article is only to share interesting charts, data points and thought-provoking opinions. It is NOT a recommendation. If you wish to consider an investment, you are strongly advised to consult your advisor. This article is strictly for educative purposes only.
Maumita Mitra is a seasoned writer specializing in demystifying the world of investment for a broad audience. She has a keen eye for detail and a knack for explaining complex financial concepts in the simplest manner possible.
Disclosure: The writer and her dependents do not hold the stocks discussed in this article.
The website managers, its employee(s), and contributors/writers/authors of articles have or may have an outstanding buy or sell position or holding in the securities, options on securities or other related investments of issuers and/or companies discussed therein. The content of the articles and the interpretation of data are solely the personal views of the contributors/ writers/authors. Investors must make their own investment decisions based on their specific objectives, resources and only after consulting such independent advisors as may be necessary.