Between April and August 2025, the Nifty 50 went through some ups and downs because of outside market influences, but it still closed out about 3.5% up.
In comparison, the Indian Pharma Index grew only slightly, at 2.5%.
The lukewarm performance of the pharma index was largely because of mixed earnings. While the rest of the pharma subsector struggled, the laboratory stocks showed sturdiness. Both Alkem Laboratories and Dr Lal PathLabs showed impressive momentum and distinguished themselves both fundamentally and technically.
Their price charts show distinctly bullish patterns with strong support and other good technical markers. This make both Alkem and Lalpath potentially attractive for investors hunting for growth in the healthcare sector.

Alkem Laboratory: Bullish Breakout
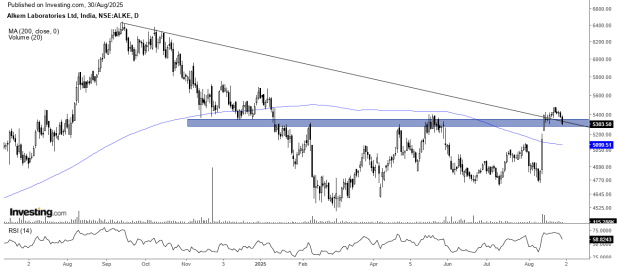
The stock began its decline in September 2024 from a peak of ₹6,400, eventually losing 30% of its value in six months. Starting February 2025, it started consolidating between ₹5,300 and ₹4,700. Despite this, the price action within the range depicted a higher top and higher bottom, which is an early indicator of a reversal.
The stock, which is currently operating above its 200-day as well as the 100-day moving averages, is underscoring the beginning of an uptrend. On top of that, the Relative Strength Index is still in bullish territory, is exhibiting bullish divergence, and is further enhancing the bullish possibilities. All these factors in conjunction imply that the stock is setting up to move upwards in the near future.
Key Alkem Lab’s Potential Signs of Reversal
- Multiple bullish patterns: Alkem Lab has broken out from the double bottom pattern and the falling trendline and is retesting it.
- 200-Day Moving Average: The moment the stock begins trading above its 200DMA for the first time after January 2025, it signals the onset of an uptrend.
- Breakout with Volume: At the time of breaking out with previous resistance volumes, we can see that Alkem Lab’s volumes are significantly greater.

Dr. Lal PathLabs: continued strong growth
Dr. Lal PathLabs’ shares declined in value, dropping from INR 3,600 to INR 2,300 over October 2024 to February 2025. The decline was subsequently reversed, and the shares have since strongly appreciated from INR 2,300 to INR 3,500, an increase of 52% between February and August 2025. Shares are trading above important resistance levels and above their 200-day moving average, which is a strong sign. The RSI is also ensuring Bullish momentum, which implies the shares are likely to appreciate further. Dr. Lal PathLabs has a positive outlook for growth in the near term, given the current technical indicators.
Dr.Lal PathLab’s Stock Reversal Analysis
- Multiple bullish breakouts: Shares initially rose due to a decrease in the falling trend and a rounding bottom. Now they are retesting that breakout.
- Volume Surge Confirming the Breakout: An Increase in price has come with a rise in volume, which shows strong investor interest.
- 200 Day Moving Average: The stock price is trading higher than its 200 DMA. This means, the stock is on an upward trend.
- RSI & Price Direction: The 14-period RSI is in the above 50 zone and showing that the stock is in strong bullish momentum.

Final Take
The pharma sector is generally considered a defensive play, but recent uncertainties, particularly surrounding US tariffs, have impacted both pharma and IT sectors. Despite this, sub-sectors within pharma, like laboratories, have shown consistent, modest growth year over year.
At this juncture, the technicals look promising. Multiple bullish patterns and a solid chart structure suggest that stocks like Alkem Laboratories and Dr. Lal PathLabs have strong potential. Compared to other sectors, these two stand out, with favorable setups that could lead to better performance in the upcoming months. Investors might find them to be potentially better positioned, given the current market conditions and their growth trajectory.
Note: The purpose of this article is only to share interesting charts, data points and thought-provoking opinions. It is NOT a recommendation. If you wish to consider an investment, you are strongly advised to consult your advisor. This article is strictly for educative purposes only.
Kiran Jani has over 15 years of experience as a trader and technical analyst in India’s financial markets. He is a well-known face on the business channels as Market Experts and has worked with Asit C Mehta, Kotak Commodities, and Axis Securities. Presently, he is Head of the Technical and Derivative Research Desk at Jainam Broking Limited.
Disclosure: The writer and his dependents do not hold the stocks discussed here. However, clients of Jainam Broking Limited may or may not own these securities.
The website managers, its employee(s), and contributors/writers/authors of articles have or may have an outstanding buy or sell position or holding in the securities, options on securities or other related investments of issuers and/or companies discussed therein. The content of the articles and the interpretation of data are solely the personal views of the contributors/ writers/authors. Investors must make their own investment decisions based on their specific objectives and resources, and only after consulting such independent advisors if necessary.

