

By Ashok Gulati and Purvi Thangaraj
The National Statistical Office recently released provisional estimates for FY23, with the GDP growth pegged at 7.2%. This has given a boost to the Modi government, as India’s growth surpasses other G20 countries. Furthermore, the Reserve Bank of India expressed optimism that, even in FY24, India’s GDP is likely to grow at 6.5%, once again outperforming other G20 nations.
As the Modi government marks the completion of nine years, a lot has been written about its achievements and failures in various fora. We feel that any performance evaluation has to be done on at least three parameters that have significant implications for the welfare of the masses on sustainable basis. These three areas would be the macroeconomic performance in terms of overall GDP growth, sectoral performance of agriculture, and the welfare schemes for the poor. We do this evaluation of the Modi government (2014-15 to 2022-23) in comparison to the average performance of the 10 years of the Manmohan Singh government (2004-05 to 2013-14).
Also read: Parag Parikh Flexi Cap Fund Factsheet: Rs 10,000 SIP grows to Rs 31 lakh in 10 years. Key Points
At a macroeconomic level, GDP growth and inflation are surely fundamental indicators to judge any government’s performance. We would add to this the foreign exchange reserves, which are critical to provide financial resilience to the economy in the wake of any external shocks. This indicator needs to be given due recognition, given what is happening to countries in our neighbourhood (the Pakistani and Sri Lankan currencies) when they don’t have enough forex reserves.
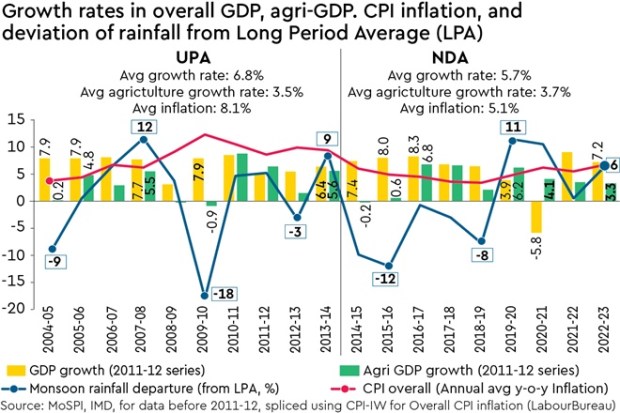
The accompanying infographic shows that the average annual GDP growth rate during the nine-year tenure of the Modi government (2014-15 to 2022-23) stands at 5.7%. In contrast, the UPA period (2004-05 to 2013-14) recorded an average growth rate of 6.8% (as per the latest revised series data with the 2011-12 base). However, it is worth noting that in the older series (with the 2004-05 base at factor cost), the UPA’s average GDP growth rate was 7.7% for the 10-year period, a whopping 2 percentage points higher than the Modi period. Suffice it to say that when the older series was revised in 2018, which pulled down the growth in the UPA period by 0.9 percentage point, it created quite a bit of controversy. We don’t get into that controversy here, except noting that even in the revised series, UPA’s performance in terms of GDP growth was better than that of the Modi government.
But in terms of taming CPI inflation, the Modi government has done a much better job by holding inflation at 5.1% vis-à-vis the Manmohan Singh period, when it averaged 8.1%. Higher inflation generally is not considered good for the poor as it inflicts a hidden tax on their incomes. In terms of forex reserves too, the Modi government’s performance has been commendable, as reserves increased from $313 billion on May 23, 2014, to $589 billion on May 26, 2023. This gives a lot of financial stability and resilience to the economy, especially the currency.
Also read: Don’t hamstring creditors: Insolvency board’s proposal for preference voting is flawed
However, the quality of growth has to be judged by how inclusive it is. This, in turn, depends on the performance of the sector that engages the largest chunk of the workforce (45.6%), i.e, agriculture. Here, both governments have achieved almost similar outcomes. Despite two successive years of drought, 2014-15 and 2015-16, the Modi government achieved an average agri-GDP growth of 3.7% vis-à-vis 3.5% during the Manmohan Singh period, which faced a drought in 2009-10.
But when it comes to the social sector welfare schemes (safety nets), the Modi government appears to have surpassed the achievements of the Singh government. Per the international definition of extreme poverty ($2.15 per capita per day, 2017 PPP), the World Bank estimated India’s extreme poverty rate at 23% in 2011, which declined to 10% in 2019. Meanwhile, the Gini index, a measure of income inequality, remained constant at 36% during the same period.
To further assess progress in the social sector, we considered three parameters:
(a) The average annual person-days generated under the Mahatma Gandhi National Rural Employment Guarantee Act since its inception. Under the UPA government, it was 208 crore, which increased to 248 crore during the nine-year period of the NDA II government;
(b) The average annual number of houses constructed under the Indira Awaas Yojana (IAY) and Pradhan Mantri Awaas Yojana-Gramin (PMAY-G), which rose from 22 lakh houses to 34 lakh houses per year;
(c) The achievement of open defecation free (ODF) status: ODF status rose from 38.7% on October 2, 2014, to 100% on October 2, 2019. To sustain this, the second phase, ODF plus, was introduced. As of June 5, 2023, 55% of India’s villages have declared themselves ODF plus.
However, there is one more critical factor that deserves mention if the masses have to move to higher productivity jobs: skill development. The PM Kaushal Vikas Yojana has played a significant role in this aspect by providing skill training to over 1.37 crore young individuals, enhancing their employment opportunities. It may also be noted that the Modi government has focused on fostering entrepreneurship and empowering youth to become job creators. The Startup India programme has been instrumental in this regard, leading to a remarkable increase in the number of recognised start-ups—a 100-fold jump since 2016.
Overall, while the Modi government’s performance in terms of GDP growth has been somewhat subdued, it has succeeded in taming inflation, keeping agri-growth respectable, and doing a much better job on welfare schemes than the UPA.
Writers are respectively, distinguished professor and research associate, ICRIER
Views are personal