")
In India, precious-metal investing conversations usually turn in two predictable ways.
One revolves around gold prices, where they are, where they might go, and whether it makes sense to buy coins, ETFs, or sovereign bonds.
The other focuses on headline stocks: large jewellery chains with nationwide visibility or metal-linked giants that institutional investors track closely.
What hardly ever gets attention is the middle layer of the precious-metal ecosystem. Companies that don’t mine gold, don’t rule advertising hoardings, but quietly turn metal into earnings through manufacturing, wholesaling, exports, and disciplined execution.
These businesses don’t benefit from narrative momentum. They benefit from the process. That makes them easy to ignore, and sometimes, misprice.
Today, we look at three such under-the-radar stocks.
They operate at different points in the precious-metal value chain, but share a common feature: they are lucrative, mid to small-cap companies with what appear to be reasonable valuations, yet far less reviewed than their larger peers.
RBZ Jewellers: The Manufacturing Powerhouse Hiding in Plain Sight
At first glance, RBZ Jewellers is often put together with structured retail jewellers. That classification misses the business angle entirely.
RBZ’s core strength is not retail visibility; it is manufacturing and wholesale supply. The company produces gold jewellery and supplies it to a large network of retailers across India.
Its finances are driven by design efficiency, manufacturing scale, and inventory rotation, not by showroom footfalls or advertising spends. That difference shows up clearly in the numbers.
RBZ Financial Performance (FY23 -FY26 (H1))
| Metric | FY23 | FY24 | FY25 | FY26 (H1) |
| Revenue (cr) | 288 | 327 | 530 | 221 |
| EBITDA (cr) | 38 | 38 | 65 | 41 |
| Net Profit (cr) | 22 | 22 | 39 | 25.7 |
| EBITDA Margin (%) | 13% | 12% | 12% | ~19% |
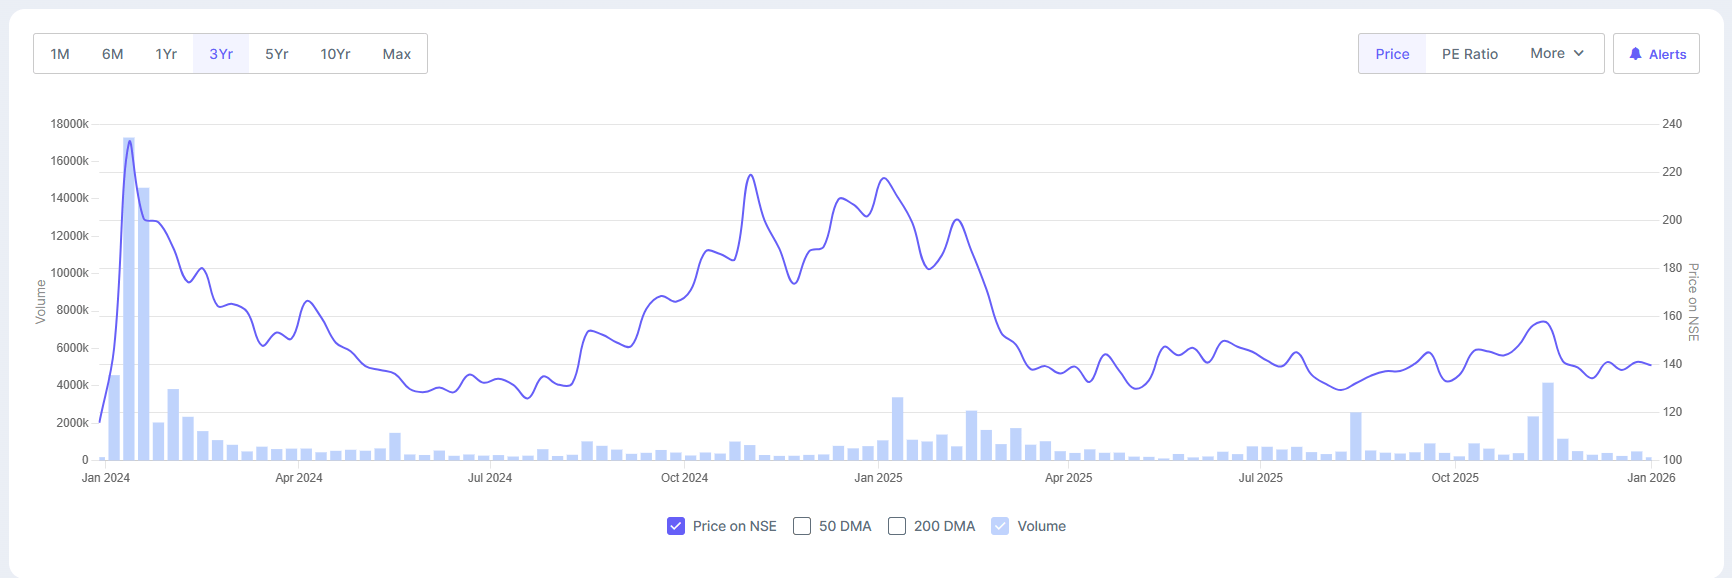
In Q2 FY26, the company posted revenue of ₹145 crore. The net profit (excluding exceptional items) was ₹19 crore, marking a jump of 130% YoY. A look at the steady profit margins shows that the company is growing without compromising on profitability.
The profit increased at a compounded rate of 39% over the last three years, and the return on equity was 18% during the same period. However, the stock price fell 28% over the past year.
RBZ Jewellers Share Price Trend
What makes it stand out
RBZ’s standout quality is operating discipline, with operating margins growing each quarter in FY26. Capital is deployed into production and inventory, not brand-building. This keeps returns on capital healthy even as the business scales.
The gradual improvement in margins with revenue increase implies better utilisation of manufacturing capacity and tighter cost control, signals that seldom show up in loud headlines but matter deeply for long-term valuation.
Why is it forgotten
Wholesale jewellery is not a thrilling story. Investors tend to drift toward consumer brands, even when wholesale businesses may render steadier economics. RBZ sits in that blind spot.
Why could it surprise investors?
Peer comparisons show RBZ trades at a P/E multiple of ~12x, much lower than the industry median of ~27x. Its enterprise value/EBITDA (earnings before interest, taxes, depreciation, and amortisation) at ~9x is significantly below the sector median of ~15x. If jewellery demand stays constant and RBZ continues to scale without overextending working capital, the stock’s valuation gap versus organised retail peers could potentially narrow, driven not by hype but by consistent earnings.
Conversely, this stock with a market cap of 568 crore is very small and should be considered highly illiquid.
Golkunda Diamonds: A High-Growth Bet on Global Jewellery Exports
Golkunda Diamonds & Jewellery operates in a different rhythm altogether.
Its business centres on manufacturing and exporting diamond-studded gold jewellery, making it more dependent on global demand, currency movements, and client relationships than to domestic footfall trends.
That export preference creates a different risk-reward profile from purely India-focused jewellers. The export demand has remained steady, with margin growth driven by better product mix and operating leverage rather than aggressive pricing.
Golkunda Financial Performance (FY23 -FY26 (TTM))
| Metric | FY23 | FY24 | FY25 | FY26 (TTM) |
| Revenue (cr) | 233 | 230 | 252 | 286 |
| EBITDA (cr) | 15 | 16 | 20 | 22 |
| Net Profit (cr) | 9.4 | 9.6 | 11.8 | ~14 |
| EBITDA Margin (%) | 7% | 7% | 8% | 8% |
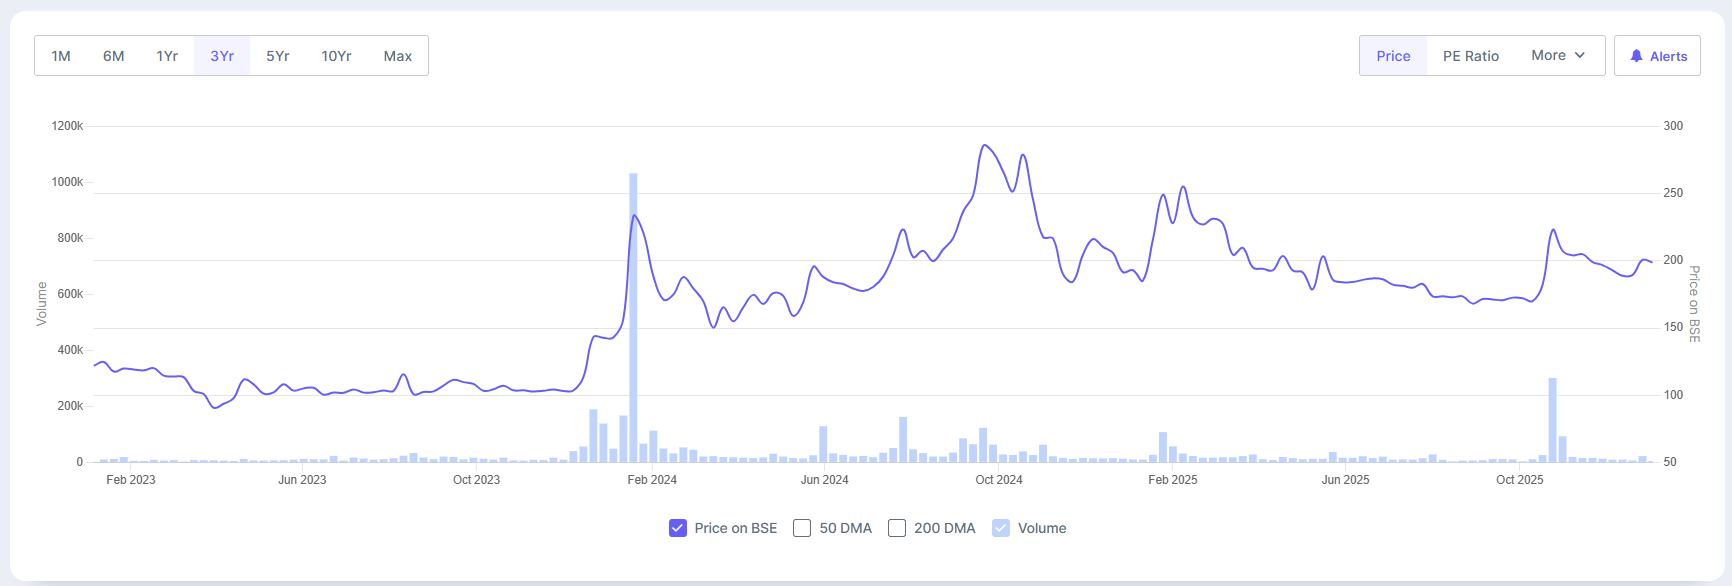
Q2 FY26 saw revenues reach approximately ~₹81 crore, with margins hovering between 6-7%, indicating that scale is not compromising profits. The net profit excluding exceptional items was ₹3 crore, marking a jump of 203% YoY.
The profit grew at a compounded rate of 17% over the last three years, and the return on equity was 20% during the same period. The stock price rose at a CAGR of 18% over the past three years.
Golkunda 3-Year Share Price Trend
What makes it stand out
Golkunda’s depth lies in diversification. Revenues are affected not just by gold prices, but also by currency changes and export demand. Such diversification can help to steady earnings when the demand for jewellery in the country softens.
The company’s expanding margins suggest it is extracting more value from each unit of output, an encouraging sign in a business where input costs are volatile.
Why is it overlooked?
Export-oriented jewellery manufacturers don’t really attract conventional attention unless growth is explosive. Golkunda’s progress has been steady, not sensational, and that often keeps valuations subdued.
Why could it surprise investors?
Peer comparisons show Golkunda’s P/E is at ~10x multiples, much lower than the median of ~27x. Its enterprise value/EBITDA (earnings before interest, taxes, depreciation, and amortisation) at ~7x is notably below the sector median of ~15x. With a single-digit EV/EBITDA multiple and improving profitability, even incremental earnings upgrades could potentially drive re-rating if export momentum holds.
However, do note that this is an extremely small company with a market cap of just 140 crores. And therefore it carries additional risk related to it being an illiquid stock, among other things.
TBZ: Can a 150-Year-Old Brand Deliver Modern-Day Compounding?
TBZ is among the oldest Indian jewellery brands, but its stock rarely features in market conversations today.
Thrust between national chains and regional players, it has silently concentrated on improving store efficiency and margins instead of pursuing aggressive expansion.
Early indicators suggest better supply management and increased conversion at existing stores, which support profit margins without heavy capital expenditure.
TBZ Financial Performance (FY23 -FY26 (TTM))
| Metric | FY23 | FY24 | FY25 | FY26 (TTM) |
| Revenue (cr) | 2,394 | 2,299 | 2,620 | 2,769 |
| EBITDA (cr) | 124 | 146 | 181 | 214 |
| Net Profit (cr) | 40 | 54 | 68 | |
| EBITDA Margin (%) | 5% | 6% | 7% | 8% |
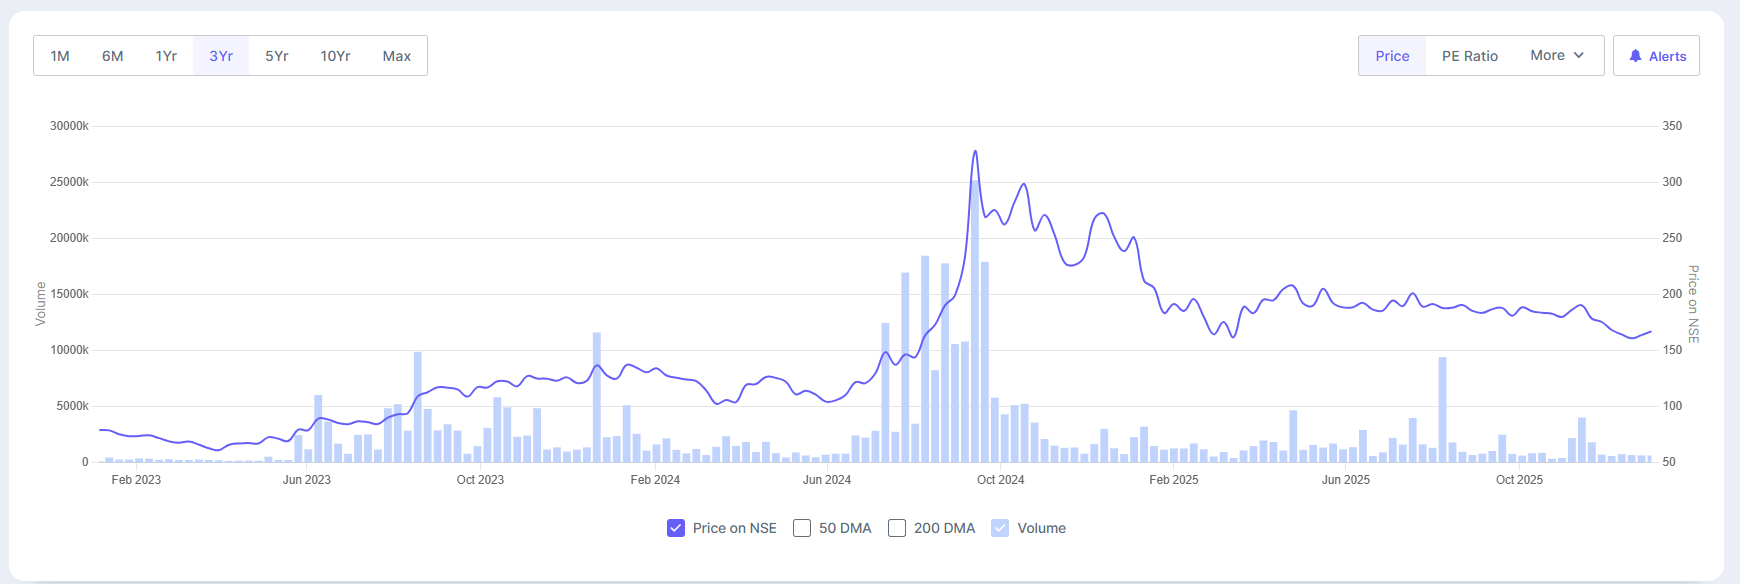
In Q2 FY26, the jeweller posted a sales revenue of ₹688 crore, with margins holding steady at 9% in the last quarter as well. This shows their growth is driven by operational efficiencies. The net profit (excluding exceptional items) rose to ₹32 crore, a leap of 163% YoY.
Over the last three years, the profit grew at a compounded rate of 50%, and the return on equity was 9% during the same period. The stock price rose at a CAGR of 28% over the past three years.
TBZ-Year Share Price Trend
What makes it stand out
TBZ offers growth without a premium valuation. Its long operating history, increasing margins, and cautious balance-sheet approach provide downside protection that many quick-growing jewellery players lack.
Unlike newer chains, TBZ does not need rapid store expansion to grow profits; its incremental efficiency gains can do much of the work.
Why is it ignored
It does not have a “growth story” plot, and it doesn’t market itself forcefully to investors. That keeps expectations and valuations low.
Compared to other players in this sector, TBZ’s P/E stands at ~12x multiples, significantly below the median of ~27x. Its EV/EBITDA (earnings before interest, taxes, depreciation, and amortisation) at ~8.4x is remarkably under the sector median of ~15x.
Why could it surprise investors?
If margins continue to inch up and store productivity improves further, TBZ may provide steady earnings compounding without dramatic strategic shifts.
With a market cap of 1,116 crores, the TBZ stock may not be as liquid as other stocks in this sector are.
The Double-Edged Sword: Gold Volatility and Working Capital Risks
Despite their attraction, these stocks are not without risk.
Working capital strength is still one of the biggest common challenges. Inventory errors can quickly eat into cash flows. Moreover, Gold price instability can upset demand cycles and inventory decisions.
Export exposure, like Golkunda, can add currency and geopolitical risks. Competitive demands in organised jewellery persist, especially during demand slowdowns.
What matters more is the speed and efficacy of execution here than a dramatic narrative.
Where the Real Precious-Metal Edge Lies
In Indian equities, precious metals are often reduced to a binary bet; you either trust in gold prices, or you buy the biggest jewellery brands and hope scale does the rest. Both these methods are relatively simple. Neither is where mispricing usually lives.
The quieter opportunity lies in how efficiently metal is turned into earnings. RBZ, Golkunda and TBZ aren’t trying to reinvent the jewellery business.
What they are doing instead is more restrained, strengthening processes, improving stock turns, and getting incremental margin from scale that already exists.
That discipline shows up in the numbers: steady revenue growth, improving EBITDA margins, and valuations that continue to be in the low-teens despite working progress through FY25 and into FY26.
Remarkably, none of these stocks depend on a dramatic rise in gold prices to justify their case. They work even when the gold price is volatile, demand is uneven, and the growth slows down, as long as execution holds.
That’s an important difference in a sector where price shifts can quickly hide weak fundamentals.
For investors, the way to go is less about guessing the next move in bullion and more about knowing where the market underrates boring consistency.
These are businesses where small developments compound quietly, where valuation support exists on the downside, and where re-rating tends to happen only after performance is evident for several years.
In precious metals, the loudest stories are rarely the most rewarding. The real edge often lies with companies that treat gold not as a speculation, but as a raw material to be overseen, handled, and monetised better than others.
That’s the common thread among these three stocks, and the reason they warrant a closer look now.
Disclaimer:
Note: We have relied on data from www.Screener.in throughout this article. Only in cases where the data was not available have we used an alternate, but widely used and accepted source of information.
The purpose of this article is only to share interesting charts, data points, and thought-provoking opinions. It is NOT a recommendation. Some of the securities mentioned in the article are only suitable for investors with a sophisticated understanding of capital markets and a demonstrated capacity for total loss of principal. Due to low liquidity, investors must be prepared for severe price volatility and material difficulty in exiting the position. This article provides factual analysis only and is not, and should not be construed as, an offer, solicitation, or recommendation to buy or sell securities. Investors must conduct their own independent due diligence and seek advice from a SEBI-registered financial advisor.
Archana Chettiar is a writer with over a decade of experience in storytelling and, in particular, investor education. In a previous assignment, at Equentis Wealth Advisory, she led innovation and communication initiatives. Here she focused her writing on stocks and other investment avenues that could empower her readers to make potentially better investment decisions.
Disclosure: The writer and her dependents do not hold the stocks discussed in this article.
The website managers, its employee(s), and contributors/writers/authors of articles have or may have an outstanding buy or sell position or holding in the securities, options on securities or other related investments of issuers and/or companies discussed therein. The content of the articles and the interpretation of data are solely the personal views of the contributors/ writers/authors. Investors must make their own investment decisions based on their specific objectives, resources and only after consulting such independent advisors as may be necessary.