

By Kiran Jani
Understanding the Patterns
- Bullish Continuation Pattern occurs when a stock in an uptrend undergoes a healthy price and time correction before resuming its previous bullish trend. A breakout from this pattern signals a potential continuation of upward momentum.
- Bullish Reversal Pattern: This forms when a stock in a downtrend consolidates at the bottom and then breaks out, signalling a shift from a bearish to a bullish trend.
Both patterns that indicate potential upside opportunities in the telecom sector. Watch these stocks as they navigate key technical levels.
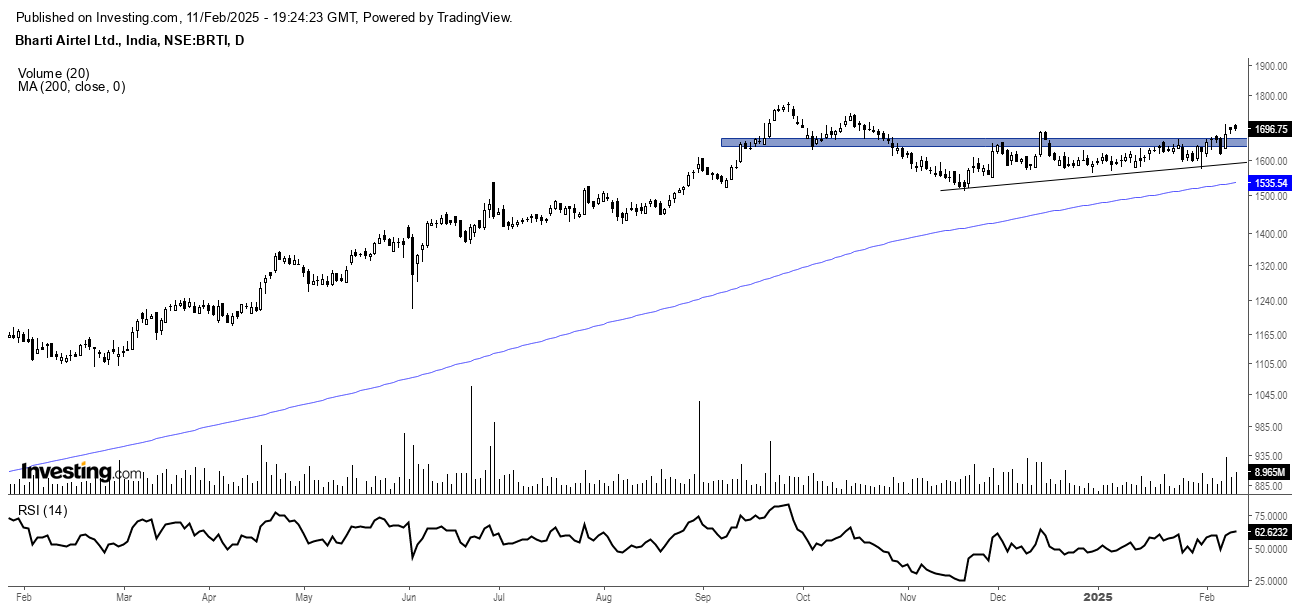
1. Bharti Airtel Limited – Bullish Continuation Pattern
From the beginning of 2024 to the present, Bharti Airtel has delivered an impressive 66% return. After reaching a high of ₹1,179 in October 2024, the stock underwent a correction, touching a low of ₹1,542. It has rebounded from a strong long-term support level at ₹1,540, indicating a potential upside.
Key technical indicators supporting the Bullish Outlook:
- Ascending Triangle Pattern – The stock has formed an ascending triangle, a classic bullish continuation pattern signalling a potential breakout.
- Volume Surge – Recent price and volume movements suggest increasing investor participation, reinforcing the bullish sentiment.
- RSI in Bullish Zone—The 14-period RSI is trading above 60, indicating strong momentum and potential for further gains.
Source: Investing.com
Outlook – Bharti Airtel
Bharti Airtel’s stock has been in a corrective phase, declining from ₹1,779 to ₹1,511 over the past three months in 2024. However, the price action now reflects a higher-top, higher-bottom pattern, indicating that the stock is in a substantial accumulation zone. Multiple technical chart patterns reinforce the likelihood of an upward move from here, making it a stock to watch in the coming weeks.
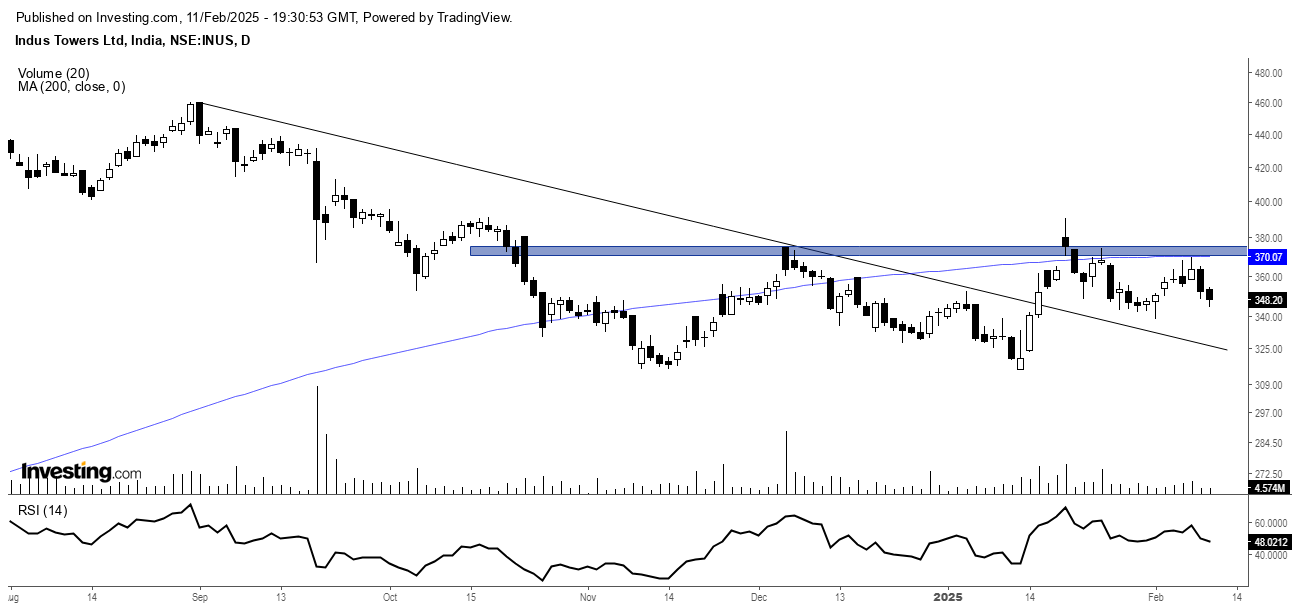
2. Indus Towers Limited – Bullish Reversal pattern
Indus Towers had a strong start in 2024, delivering a 72% return before correcting from a high of ₹460 in September 2024. However, its daily chart now signals a potential bullish reversal, supported by key technical indicators:
- Falling Trendline Breakout—The stock has broken out of its short-term falling trendline, signaling a bullish reversal.
- Double Bottom Formation – A breakout from this pattern could confirm renewed upside momentum.
- RSI Strength – The 14-period RSI has exhibited a bullish divergence, reinforcing the probability of a trend reversal.
Source: Investing.com
Outlook – Indus Towers
Indus Towers has undergone a correction from ₹460 to ₹315 over the past five months (September 2024 to January 2025). While the stock is trading below its 200-day moving average (DMA), it has started forming a higher-top, higher-bottom pattern—a sign of accumulation and potential trend reversal.
Several technical indicators reinforce the case for an upward move, suggesting that the stock could be poised for a recovery in the coming weeks. Investors may keep an eye on key resistance levels and confirmation signals for further strength.
Telecom stocks: Gearing up for a promising future
Despite recent corrections, the telecom sector shows strong technical signals for a potential rebound. Bharti Airtel Limited and Indus Towers Limited stand out with compelling chart patterns that indicate renewed strength.
- Bharti Airtel is forming a bullish continuation pattern, supported by an ascending triangle breakout, rising volume, and strong RSI momentum.
- Indus Towers signals a bullish reversal, with a falling trendline breakout, double-bottom formation, and bullish RSI divergence, suggesting a possible trend shift.
While market fluctuations continue, these stocks exhibit strong accumulation zones and technical breakouts, making them potential candidates for upside movements. Investors should monitor key levels and confirmation signals as the sector gears up for a promising future.
Disclaimer
Note: The purpose of this article is only to share interesting charts, data points and thought-provoking opinions. It is NOT a recommendation. If you wish to consider an investment, you are strongly advised to consult your advisor. This article is strictly for educative purposes only.
As per SEBI guidelines, the writer and his dependents may or may not hold the stocks/commodities/cryptos/any other assets discussed here. However, clients of Jainam Broking Limited may or may not own these securities.
Kiran Jani has over 15 years of experience as a trader and technical analyst in India’s financial markets. He is a well-known face on the business channels as Market Experts and has worked with Asit C Mehta, Kotak Commodities, and Axis Securities. Presently, he is Head of the Technical and Derivative Research Desk at Jainam Broking Limited.
Disclosure: The writer and his dependents do not hold the stocks discussed here. However, clients of Jainam Broking Limited may or may not own these securities.
The website managers, its employee(s), and contributors/writers/authors of articles have or may have an outstanding buy or sell position or holding in the securities, options on securities or other related investments of issuers and/or companies discussed therein. The content of the articles and the interpretation of data are solely the personal views of the contributors/ writers/authors. Investors must make their own investment decisions based on their specific objectives and resources, and only after consulting such independent advisors if necessary.