

The FMCG sector remained quiet in the last financial year. However, in 2024-2025, Nifty FMCG hit a low of 52,400 and surged to 66,500 by September 2024. Unfortunately, the rally didn’t last, dropping below 52,400.
But since March 2025, we’ve seen signs of recovery, continuing into April. Over the past two months, Nifty FMCG has gained 13.2%, bouncing back from 50,200 to 56,000. This recovery is partly due to RBI rate cuts and tax benefits announced in the budget, boosting market sentiment and stabilising prices. Sectors like FMCG, real estate, auto, and finance show signs of recovery. Given the current trends, the FMCG sector looks set to perform well in the coming months.
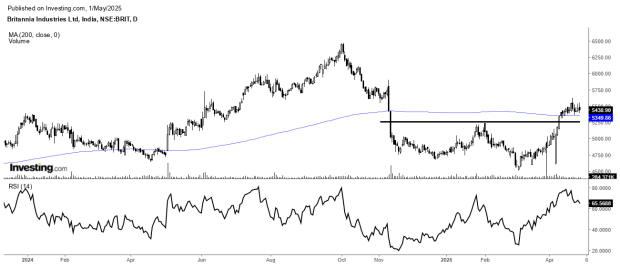
Britannia Ind: Bullish Reversal After a 30% Drop
Britannia experienced a 30% drop from its peak in October 2024, falling from ₹6,460 to ₹4,500. However, recent price movements suggest a potential recovery, as the stock has bounced back. This indicates renewed investor interest and the possibility of an upward trend.
Key Indicators of Britannia’s Recovery:
- Double Bottom Pattern: The stock forms a “double bottom” pattern, often a sign of an upward price movement.
- 200-Day Moving Average: The stock stays above its 200-day moving average, a positive sign for trend reversal.
- Rising Volume: Increasing trading volume indicates strong market participation and potential trend change.
- Stronger RSI: The Relative Strength Index (RSI) crossing above 60 suggests continued upward momentum.
Outlook for Britannia
Britannia Ind saw a 40% return from April to October 2024, but the stock price dropped from ₹6,400 to ₹4,500. Despite this, signs of recovery are emerging. The stock has formed a bullish double bottom pattern and is trading above its 200-day moving average, suggesting a potential upward trend. The 14-period RSI has also moved into the bullish zone, indicating growing momentum. These signals point to a promising upside, making Britannia a potentially attractive option for recovery-focused investors.
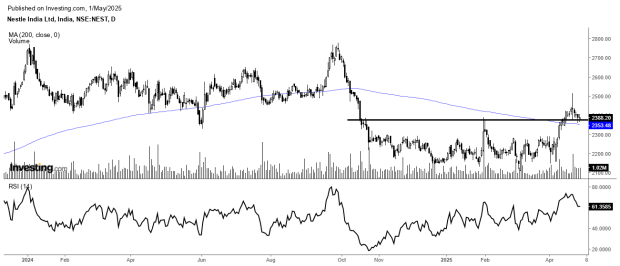
Nestle: Ready for a Potential Reversal After Correction
Nestle experienced a 24% drop from September 2024 to March 2025, but the stock has shown signs of recovery in recent weeks. Bullish signals on the daily chart suggest that the previous upward trend could resume, indicating the start of a potential reversal phase.
Key Technical Indicators Supporting Nestle’s Reversal:
- Double Bottom Pattern: The formation of this pattern suggests the stock price may begin to rise.
- 200-Day Simple Moving Average: After the correction, Nestle has found support and is trading above its 200-day moving average, signalling bullish sentiment and a potential trend reversal.
- Volume Surge: The increase in trading volume alongside rising prices confirms strong participation and validates the breakout.
- RSI Momentum: The 14-period RSI crossing above 60 indicates strengthening momentum and further upside potential.
Outlook for Nestle
Nestle’s price was range-bound from April to August 2024, before breaking out and delivering a 13% return from August to September. However, the stock recently faced pressure, dropping from ₹2,780 to ₹2,100. Despite this decline, technical indicators suggest early signs of recovery. The breakout above a key bullish pattern, rising volumes, and a strengthening RSI indicate that Nestle could be poised for an upward move, making it a potential opportunity for investors.
Final Take
Both Britannia and Nestle are showing strong technical signals, indicating a potential bullish trend. They are forming bullish chart patterns, with rising RSI readings and key breakouts, suggesting increasing momentum. The FMCG sector will likely benefit from improved affordability and market sentiment with the budget tax limit increase and RBI rate cuts. These factors make Britannia and Nestle even more attractive for investors, with a positive outlook for growth in the coming months.
Note: The purpose of this article is only to share interesting charts, data points and thought-provoking opinions. It is NOT a recommendation. If you wish to consider an investment, you are strongly advised to consult your advisor. This article is strictly for educative purposes only.
As per SEBI guidelines, the writer and his dependents may or may not hold the stocks/commodities/cryptos/any other assets discussed here. However, clients of Jainam Broking Limited may or may not own these securities.
Kiran Jani has over 15 years of experience as a trader and technical analyst in India’s financial markets. He is a well-known face on the business channels as a Market Expert and has worked with Asit C Mehta, Kotak Commodities, and Axis Securities. Presently, he is Head of the Technical and Derivative Research Desk at Jainam Broking Limited.
Disclosure: The writer and his dependents do not hold the stocks discussed here. However, clients of Jainam Broking Limited may or may not own these securities.
The website managers, its employee(s), and contributors/writers/authors of articles have or may have an outstanding buy or sell position or holding in the securities, options on securities or other related investments of issuers and/or companies discussed therein. The content of the articles and the interpretation of data are solely the personal views of the contributors/ writers/authors. Investors must make their own investment decisions based on their specific objectives and resources, and only after consulting such independent advisors if necessary.