")

By Kiran Jani
The chemical sector, which has been on a downward trend for the past five months is finally showing signs of a recovery. With prices stabilising and the broader market improving, some stocks are showing potential for a turnaround.
HEG and Graphite have formed potential reversal patterns, indicating possible opportunities for traders and investors.
HEG – A bullish reversal taking shape
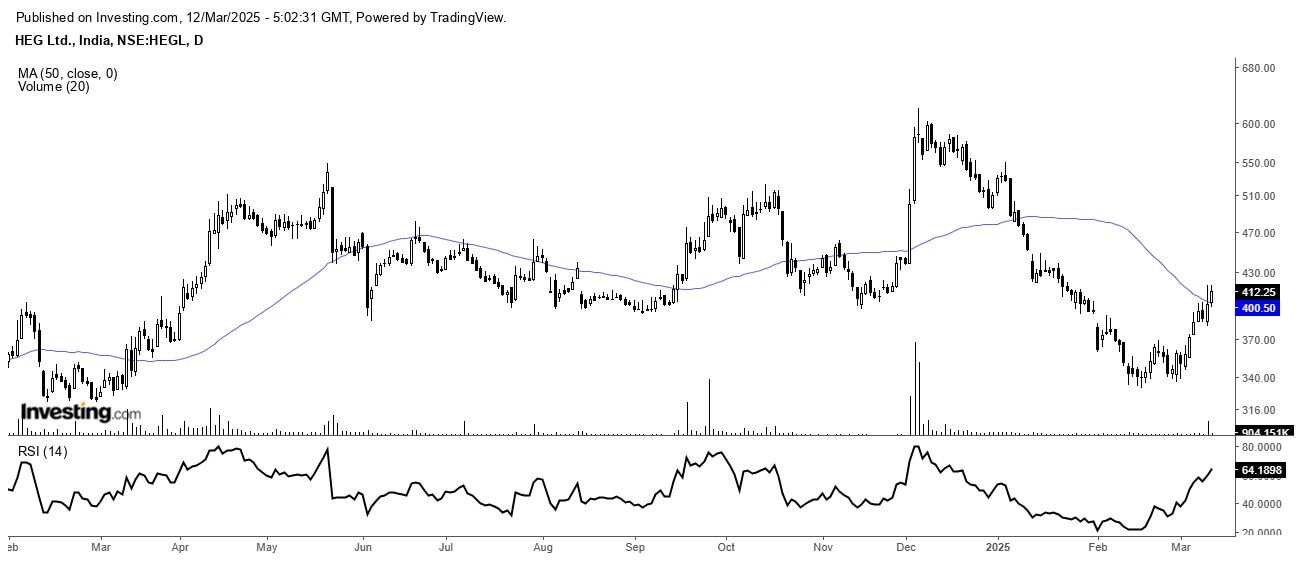
HEG saw a sharp 46% decline from its December 2024 peak of ₹620, hitting a low of ₹330. However, a decisive rebound from this long-term support level suggests renewed buying interest and a possible trend reversal.
Key indicators supporting HEG’s strength:
- Double-Bottom Breakout – The stock has broken out of a key double-bottom pattern, reinforcing bullish sentiment.
- 50-SMA Crossover – HEG is trading above its 50-day Simple Moving Average (SMA) for the first time since January 2025, signalling a potential trend shift.
- Volume Surge Confirming Breakout – A simultaneous rise in price and volume suggests strong participation, validating the upward momentum.
- Strengthening RSI Momentum – The 14-period Relative Strength Index (RSI) above 60 indicates bullish divergence, pointing to further upside potential.
Outlook: HEG Limited
HEG delivered a strong 100% return in 2024, but the stock has been in a correction phase, dropping from ₹620 to ₹330 over the past three months.
Now, early signs of a potential recovery are visible. The stock has formed a bullish double-bottom pattern, and its price has moved above the 50-day SMA with rising volume, a key signal of accumulation before an upward move. These technical indicators suggest that HEG could be potentially setting up for a rebound.
Graphite India – Bullish reversal in play
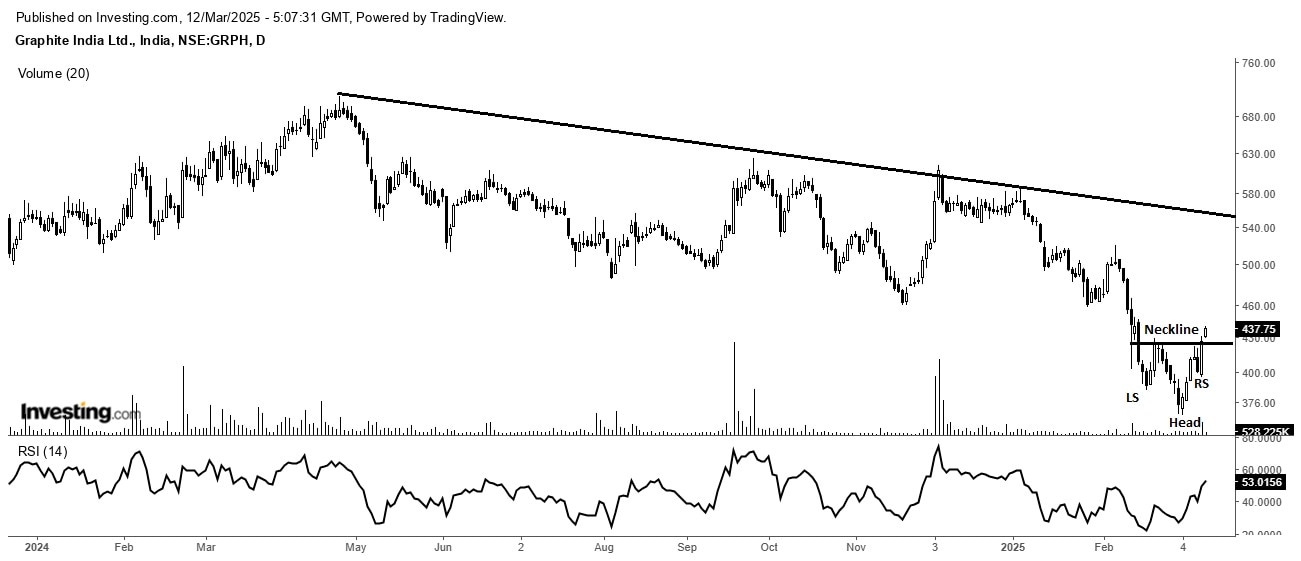
Graphite India remained under pressure in 2024, delivering a negative 48% return. However, the stock shows early signs of a potential turnaround, with bullish signals emerging on the daily chart.
Key Technical Indicators:
- Inverted Head and Shoulders Breakout – A classic bullish reversal pattern has formed, signalling a possible trend change.
- Volume Surge – Rising price and volume suggest substantial accumulation and confirm a breakout.
- RSI Gaining Strength – The 14-period RSI is above 50, indicating improving momentum and potential for further upside.
Outlook: Graphite India
The past year has been challenging for Graphite India, with the stock correcting from ₹710 to ₹370. However, recent technical signals indicate a potential shift in momentum.
The stock has formed a bullish reversal head and shoulders pattern, a classic accumulation signal and a possible trend reversal. Strengthening this setup, the 14-period RSI has entered the bullish zone, suggesting improving momentum.
Final Take
With strong reversal signals in play, HEG and Graphite India show early signs of a potential comeback. Their bullish chart patterns, rising RSI, and key technical breakouts suggest that momentum is building. While market volatility remains a factor, these stocks could present attractive upside opportunities.
Keeping an eye on key resistance levels and confirmation signals will be crucial; the next move could be just around the corner.
Disclaimer:
Note: The purpose of this article is only to share interesting charts, data points and thought-provoking opinions. It is NOT a recommendation. If you wish to consider an investment, you are strongly advised to consult your advisor. This article is strictly for educative purposes only.
As per SEBI guidelines, the writer and his dependents may or may not hold the stocks/commodities/cryptos/any other assets discussed here. However, clients of Jainam Broking Limited may or may not own these securities.
Kiran Jani has over 15 years of experience as a trader and technical analyst in India’s financial markets. He is a well-known face on the business channels as Market Experts and has worked with Asit C Mehta, Kotak Commodities, and Axis Securities. Presently, he is Head of the Technical and Derivative Research Desk at Jainam Broking Limited.
Disclosure: The writer and his dependents do not hold the stocks discussed here. However, clients of Jainam Broking Limited may or may not own these securities.
The website managers, its employee(s), and contributors/writers/authors of articles have or may have an outstanding buy or sell position or holding in the securities, options on securities or other related investments of issuers and/or companies discussed therein. The content of the articles and the interpretation of data are solely the personal views of the contributors/ writers/authors. Investors must make their own investment decisions based on their specific objectives and resources, and only after consulting such independent advisors if necessary.