

When trading in the stock markets heats up, conversations usually revolve around where prices are headed and how much money is changing hands. Commentary follows every move. What rarely enters the conversation is what happens after the trade is done. The part that ensures the shares actually reach the investor and the money reaches the seller works quietly in the background.
India’s capital markets depend on this unseen layer. Depositories, clearing corporations, registrars and similar intermediaries handle the mechanics that turn a trade into a completed transaction. They maintain records, manage settlements, process corporate actions and reduce the risk of failure in the system. It is not glamorous work, but it is essential. Without it, confidence in the market would break down very quickly.
This segment has expanded steadily as participation in the markets has widened. The rapid rise in demat accounts, heavier trading activity and tighter regulation have all added to the workload. At the same time, technology has helped these systems handle scale more efficiently. Their growth tends to track market activity, but their role is shaped just as much by compliance and operational discipline.
Rather than focusing on one or two companies, this article looks at the market infrastructure space as a whole. The idea here is to explain why these businesses have moved from the background to the core of India’s market structure, and how they support the broader capital-markets ecosystem. For investors, the takeaway is the role these firms play in keeping the system running reliably, even when they are not in the limelight.
Beacon Trusteeship also merits attention, though it has not been examined in detail. The company listed on the NSE in April 2025, and with Q2 FY26 only recently completed, post-listing disclosures remain limited. This makes it too early to draw firm conclusions on its operating performance. A clearer picture is likely to emerge as regular quarterly reporting builds over the coming year.
#1 CDSL: The Volume King Powering 16 Crore Demat Accounts
Central Depository Services is a Market Infrastructure Institution (MII), part of the capital market structure, providing services to all market participants – exchanges, clearing corporations, depository participants (DPs), issuers and investors. It is a facilitator for the holding of securities in the dematerialised form and an enabler for securities transactions.
Central Depository Services (India) reported a steady operating quarter in Q2 FY26, even as market activity moderated from last year’s highs. Industry-wide average daily turnover at NSE and BSE declined about 18% year on year (YoY), but investor participation continued to expand. The depository added over 65 lakh demat accounts during the quarter, taking its total to 16.5 crore and maintaining around 80% market share.
Total income for the quarter declined to Rs 290 crore from Rs 324 crore in Q2 FY25, while net profit fell to Rs 128 crore from Rs 171 crore reported in Q2 FY25. The year-ago period had benefited from higher dividend income from subsidiaries, while the current quarter’s earnings were driven entirely by core operating activity.
Income from core operations remained resilient, supported by higher account additions, corporate actions and transaction-linked activity. Management highlighted progress on regulatory initiatives such as Nomination Phase 2, aimed at simplifying investor succession, and continued investments in technology and human resources to support future scale.
In the unlisted segment, CDSL admitted over 3,500 companies during the quarter, with market share of around 30–32%. Testing for a common ISIN framework is underway, which could level the playing field between depositories once operational.
Looking ahead, the company expects growth to track market participation rather than short-term volume swings, with ongoing technology spending positioned as a long-term necessity rather than a near-term cost head.
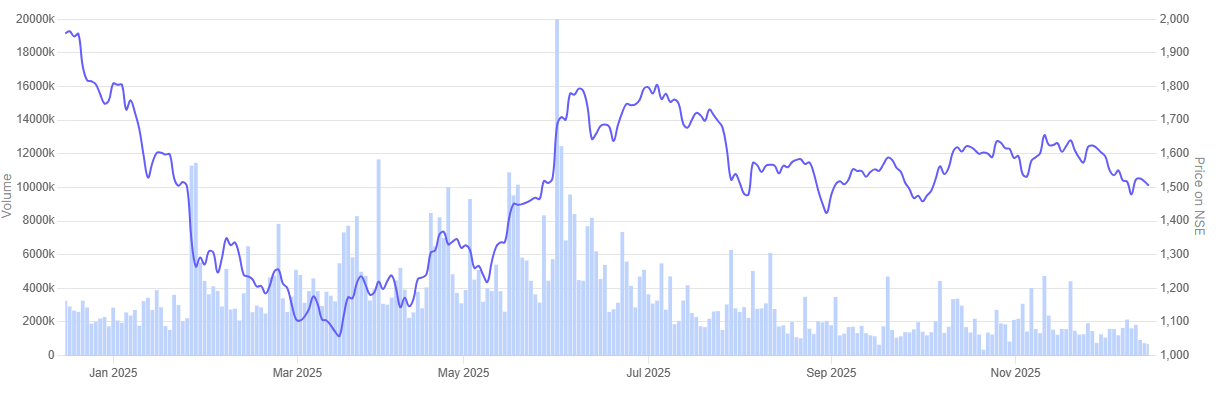
In the past one year CDSL share price tumbled 23.6%.
CDSL 1 Year Share Price Chart
#2 NSDL: The Pioneer Making a Comeback in the Retail Race
Established in 1996, National Securities Depository provides electronic infrastructure for dematerialization of securities and facilitates electronic settlement of trades in Indian Securities Market.
National Securities Depository Limited delivered a strong operating performance in the September quarter of FY26, even as parts of the secondary market showed signs of moderation. Industry-wide incremental demat account additions declined sharply, but NSDL bucked the trend. Its total demat accounts rose to 4.2 crore, with incremental market share improving to 17.6% from 9.9% a year ago, supported by new broker additions and steady retail onboarding.
On a standalone basis, total income grew 18.9% year on year to Rs 250.6 crore, while net profit rose 18.3% to Rs 120.4 crore. Growth was driven by higher transaction activity, custody fees and continued traction in the unlisted issuer segment. NSDL admitted over 11,500 unlisted companies during the quarter, taking its market share in this segment to about 73%.
The company also rolled out multiple technology initiatives, including enhancements to SPEED-e, migration to a common contract note platform and direct payout settlement. Management indicated that ongoing investments in technology and cybersecurity are front-loaded, but necessary to support long-term growth as India’s capital markets deepen.
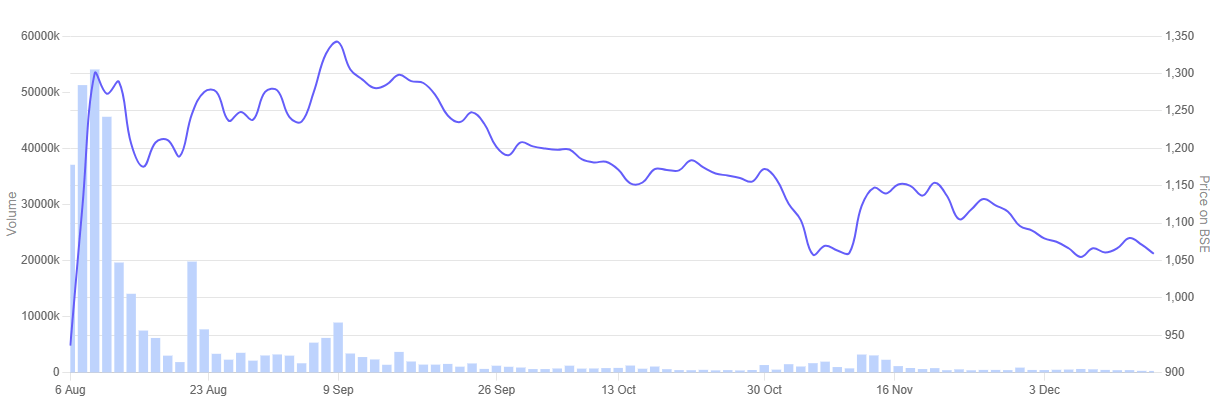
In the past one year NSDL share price is up 12.9%.
NSDL 1 Year Share Price Chart
#3 CAMS: The ‘Operating System’ of India’s Mutual Fund Industry
Computer Age Management Services is a mutual funds transfer agency. It provides investor services, distributor services to asset management companies (AMC) services.
Computer Age Management Services posted a steady performance in the September quarter of FY26, supported by growth in both its mutual fund and non-mutual fund businesses. Consolidated revenue rose 3.2% YoY to Rs 377 crore in Q2 FY26, reflecting stable asset-based income and faster growth in transaction-led services.
Net profit attributable to shareholders declined to Rs 115 crore in Q2 FY26 from Rs 122 crore reported a year ago, as higher employee and technology costs offset operating leverage. Management indicated that these investments are front-loaded and linked to platform upgrades and capacity building across businesses.
Operationally, CAMS maintained its leadership in mutual fund servicing, with assets under service crossing Rs 52 lakh crore during the quarter. Equity net sales and SIP registrations remained strong despite market volatility. The non-MF segment continued to scale, led by CAMSPay, CAMS Alternatives and KRA services, which saw healthy deal additions and rising transaction volumes.
The company also expanded its international footprint, with Think360 adding new clients in the US, and strengthened its presence in GIFT City through outbound fund launches. CAMS expects growth to track capital-market participation and digital adoption, while near-term margins remain linked to execution of ongoing investments.
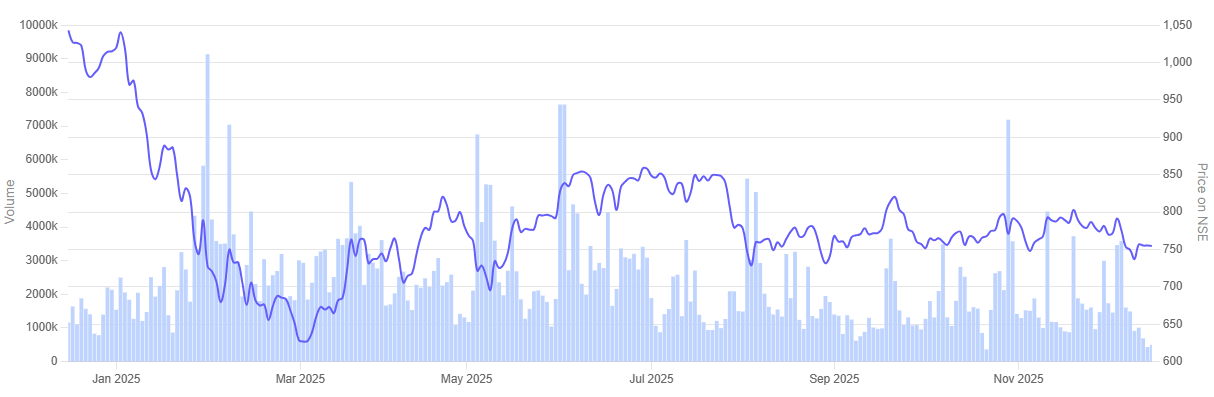
Over the past year, CAMS’s share price nosedived 27.9%.
CAMS 1 Year Share Price Chart
#4 KFin Tech: The Challenger Expanding Beyond Mutual Funds
KFin Technologies is a leading technology-driven financial services platform. The company provides services and solutions to asset managers and corporate issuers across asset classes in India and provides several investor solutions including transaction origination and processing for mutual funds and private retirement schemes in Malaysia, the Philippines and Hong Kong.
KFin Technologies reported a steady quarter in Q2 FY26, with growth spread across its core servicing segments. Consolidated revenue rose 10.3% year on year to Rs 309 crore, driven by higher activity in domestic mutual fund services, issuer solutions and overseas operations.
Net profit rose 4.5% from a year earlier to Rs 93 crore. Profitability remained stable even as spending increased on technology and integration. The company said a part of these costs was incurred upfront, linked to platform upgrades and the absorption of recent acquisitions, while scale benefits continued to support earnings.
During the quarter, KFin added fresh mandates in both mutual fund servicing and issuer solutions, alongside a regular flow of IPO assignments. Its alternatives and pension businesses also continued to expand. Assets under service in the AIF segment crossed Rs 1.8 trillion, translating into a market share of close to 40%. Overseas operations also saw steady progress, aided by fresh client additions and the acquisition of Singapore-based Ascent Fund Services, whose financials will be consolidated from the next quarter.
Going ahead, growth is expected to track market participation and the pace of new mandate wins. Management indicated that scale benefits should support margins over time, though near-term performance will continue to depend on execution and the smooth integration of recent acquisitions.
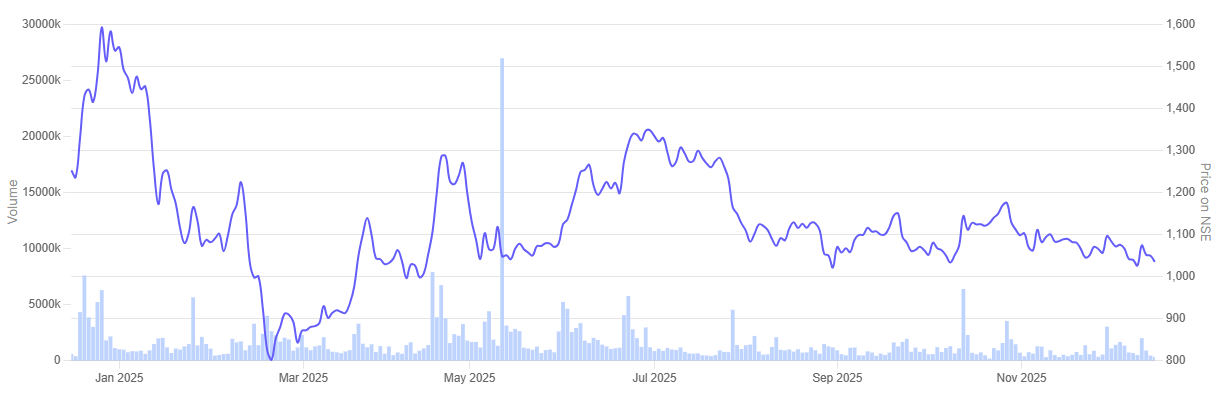
In the past one year KFin Technologies share price tumbled 17.6%.
KFin Technologies 1 Year Share Price Chart
Valuations
Let us now turn to valuations across the listed market intermediaries, using the price-to-earnings multiple as a reference point.
Valuations of Market Intermediaries in India
| Sr No | Company | P/E | ROCE | Operating Profit Margin (2025) |
| 1 | CDSL | 67.5 | 42.0% | 58.0% |
| 2 | NSDL | 64.9 | 23.6% | 26.0% |
| 3 | CAMS | 42.1 | 54.8% | 46.0% |
| 4 | Kfin Technologies | 51.8 | 32.8% | 44.0% |
These businesses are very different from lenders or balance-sheet-driven firms. They run light balance sheets, with costs that do not rise in step with volumes. As a result, margins and returns on capital matter just as much as headline earnings when looking at valuations.
A review of current valuations indicates that the market is pricing these intermediaries at relatively rich earnings multiples. The shift is not company-specific. The change in valuations reflects how the market has gradually reassessed this space. As participation has widened and trading activity has picked up, these businesses have come to be seen as more predictable, helped by recurring, fee-driven income rather than cyclical balance-sheet risk.
Within this set, CDSL remains the most richly valued, supported by its margin profile and long record of strong capital returns. CAMS continues to be valued at the upper end of the range, largely because of its scale and long-standing presence in mutual fund servicing. NSDL and KFin Technologies are priced lower in comparison, though their valuations still reflect expectations of ongoing growth and gradual improvement in profitability.
Even so, the margin for error at current prices is narrow. Much of the optimism is already reflected in prices, which means future returns are likely to hinge on execution, consistency and timing, not just the underlying quality of the businesses.
For investors, the key question is not about the quality of the businesses, but about entry price. A careful assessment of growth visibility, operating resilience and return sustainability remains essential before taking any investment call.
Conclusion
India’s market infrastructure story is easy to overlook because it runs quietly in the background. Depositories, registrars and trustee services do not sit at the front end of the trading cycle, but they are deeply embedded in how the capital market functions every day. As participation widens and regulatory standards rise, the importance of this layer has only increased. These businesses benefit from scale, fee-based models and operating leverage, giving them a degree of earnings stability that is rare within financial services.
At the same time, the sector is no longer under the radar. Valuations reflect both past execution and expectations of continued growth linked to market activity and compliance intensity. As a result, not every stock in the space will behave the same way. Variations in size, income sources, operating discipline and the ability to sustain growth can create wide gaps in performance over a market cycle.
For investors, the task is to look beyond the label of “market infrastructure” and examine each business on its own terms. Understanding where a company sits in the value chain, how resilient its earnings are and how much is already priced in becomes crucial. A careful, bottom-up assessment is therefore necessary before taking any investment call.
Note: We have relied on data from www.Screener.in throughout this article. Only in cases where the data was not available, have we used an alternate, but widely used and accepted source of information.
Disclaimer:
The purpose of this article is only to share interesting charts, data points and thought-provoking opinions. It is NOT a recommendation. If you wish to consider an investment, you are strongly advised to consult your advisor. This article is strictly for educative purposes only.
Ekta Sonecha Desai has a passion for writing and a deep interest in the equity markets. Combined with an analytical approach, she likes to dig deep into the world of companies, studying their performance, and uncovering insights that bring value to her readers.
Disclosure: The writer and her dependents do not hold the stocks discussed in this article.
The website managers, its employee(s), and contributors/writers/authors of articles have or may have an outstanding buy or sell position or holding in the securities, options on securities or other related investments of issuers and/or companies discussed therein. The content of the articles and the interpretation of data are solely the personal views of the contributors/ writers/authors. Investors must make their own investment decisions based on their specific objectives, resources and only after consulting such independent advisors as may be necessary.