")
India’s Quiet Space-Tech Counter-Offensive to the Starship Hype
Every few weeks, a fresh headline about Elon Musk’s Starship sends Indian investors scrambling to “get some SpaceX“. The only problem is most of them won’t be able to buy in. Musk’s rocket company is private, and the side-doors sold to retail investors tend to be costly, indirect, or simply shut.
Yet while SpaceX keeps trending, India is quietly running one of the busiest space and defence build-outs in its history. And a handful of listed companies build the hardware and technology behind it. Two of them stand out, for very different reasons.
One builds the optics, electronics and shielding that go into satellites, missiles and submarines. The other melts the titanium and superalloys that India’s rockets and fighter jets are made of. Both are tempting to romanticise, and both are easy to misread. Are these the space stocks India is ignoring while it chases SpaceX? Let us dive in.
#1 Paras Defence: Rs 928 cr Order Book Dominating Space Optics and Asia-Pacific Periscopes
Incorporated in 2009 as Paras Flow Form Engineering Limited and renamed Paras Defence and Space Technologies Ltd in 2016, the company is one of India’s leading players in the defence and space sector. It is the sole Indian private firm producing indigenous hyper-spectral cameras for space missions.
With a market cap of Rs 6,603 cr, the company’s work spans four areas: defence and space optics, defence electronics, heavy engineering, and electromagnetic pulse (EMP) protection. It is the only maker of submarine periscopes in the Asia-Pacific region. It is also the only domestic provider of turnkey EMP protection solutions. These are not commodity products. They take years to qualify for, which is exactly why investors have crowded in since the stock listed in October 2021.
The Financial Ledger: Why 41% Profit Growth Traps Capital in Receivables
Let us now look at the core financials of the company for the last few years to get a better understanding of how things changed since the listing.
| Financial Year | FY21 | FY22 | FY23 | FY24 | FY25 | FY26 | 5-Yr CAGR |
| Sales (Rs cr) | 143 | 183 | 222 | 254 | 365 | 477 | 27% |
| EBITDA (Rs cr) | 44 | 52 | 58 | 53 | 100 | 120 | 22% |
| Net Profit (Rs cr) | 16 | 27 | 36 | 30 | 61 | 89 | 41% |
The sales of the company have grown at a compound rate of about 27% in the last five years, from Rs 143 cr in FY21 to Rs 477 cr in FY26.
The EBITDA (earnings before interest, taxes, depreciation, and amortization) recorded a compound growth of about 22% in the same period, from Rs 44 cr to Rs 120 cr.
As for the net profits, the company has logged a compound growth of about 41%, from Rs 16 cr in FY21 to Rs 89 cr in FY26. The March 2026 quarter alone nearly doubled profits from a year earlier (Rs 21 cr).
The company also has a current ROCE (return on capital employed) of 17% and a return on equity (ROE) of 11.3%. In plain terms, for every Rs 100 of capital it puts to work, Paras generates a profit of about Rs 17.
Supported by a highly conservative capital structure, the company remains virtually debt-free, with borrowings of just Rs 27 cr against reserves of Rs 685 cr. There is one number that stands out for the wrong reason, though. Paras has debtor days of 278, and a full cash conversion cycle of about 435 days. Simply put, it waits the better part of over a year to collect the cash on a sale. That is common in defence, where the customer is often the government, but it ties up a lot of money. Profit looks strong on paper while the cash sits in receivables.
The crowd has noticed all the same. Foreign institutional investors (FIIs) who held a token 0.13% of Paras in March 2024 owned about 5% by March 2026, and the shareholder count has swelled to roughly 3.77 lakh, even as promoters trimmed their stake from about 58.9% to 53.2%.
From IPO to 2026: Evaluating a 235% Valuation Rerating
The share price of Paras was about Rs 245 when listed in October 2021 and as of closing on 29th May 2026 it was Rs 819, which is a jump of about 235% in less than 5 years. Rs 1 lakh invested at listing would have been over Rs 3.3 Lakhs today.
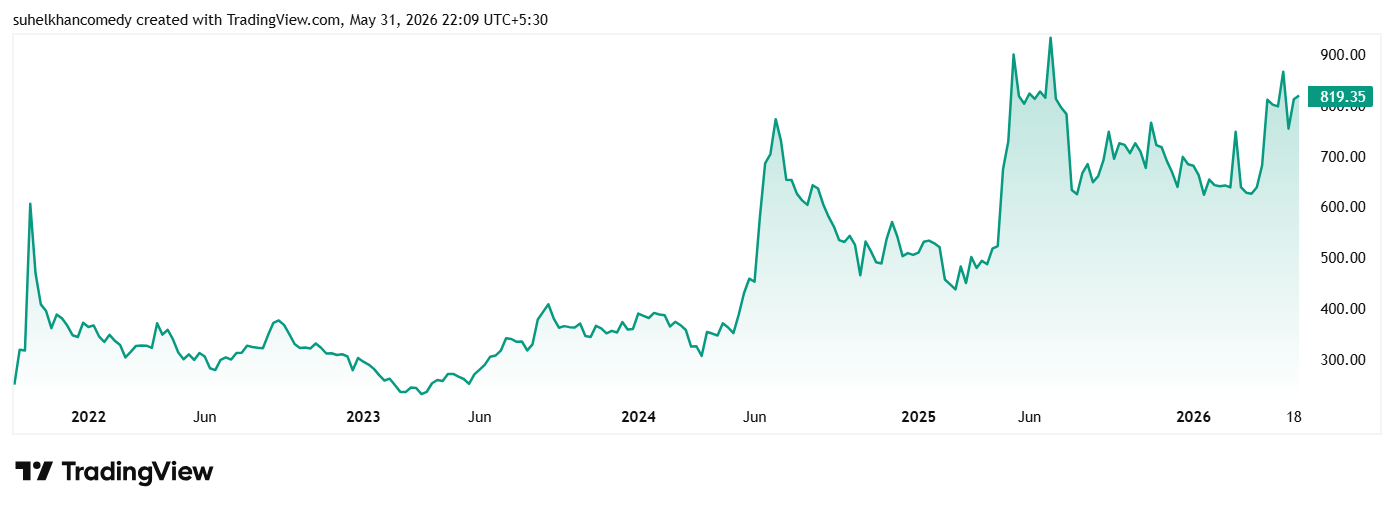
On valuations, the company’s share is currently trading at a PE of about 77x, while the broader industry median is 53x. So, Paras is relatively expensive even within an already pricey sector. Today’s price sits right at its own historical middle, even as it towers over the industry. Some have also tagged the stock an “Expensive Star”, and at about 9 times book value, the market is clearly paying up.
That is the tension in one line. The growth is real, but at roughly 79 times earnings the price already assumes years of flawless execution and a steady flow of orders. With 278 debtor days, the gap between winning a contract and banking the cash is the genuine risk. Any slip in turning that order book into collected revenue would sting.
With clients like HAL, ISRO, DRDO, Bharat Electronics, Godrej, TATA Power, Elbit Systems, Cochin Shipyard, Goa Shipyard etc, the company now has a total order book of Rs 928 Cr as opposed to Rs 576 Cr in FY25.
In Apr 2026, the company entered into a 10-year exclusive collaboration agreement with Bandak Aviation Inc., DBA Northstar, to supply and support air-to-air refuelling systems and related services for the Indian Armed Forces.
#2 Mishra Dhatu Nigam: The Sovereign Alloy Monopoly Guarding India’s Rockets
Incorporated in 1973 in Hyderabad as a Government of India enterprise under the Ministry of Defence, and listed in 2018, Mishra Dhatu Nigam Ltd (MIDHANI) is a company in which the government still owns 74%. Its claim to fame is simple but powerful. It is the only maker of titanium alloys in India.
With a market cap of Rs 7,880 cr, the company also produces superalloys, special steels and soft magnetic alloys for defence, space, energy and aeronautics, supplying customers from ISRO to the armed forces.
In March 2026 it won NADCAP accreditation for its heat-treatment facility, which strengthens its standing in aerospace and defence metallurgy. Put plainly, if India wants to build its own rockets and jet engines, MIDHANI is probably hard to avoid. The moat is real.
Squeezed Yields and Negative Growth: Analyzing the -7% Profit Slide
Let us look at the financials of the company over the last five years.
| Financial Year | FY21 | FY22 | FY23 | FY24 | FY25 | FY26 | 5-Yr CAGR |
| Sales (Rs cr) | 813 | 859 | 872 | 1,073 | 1,074 | 1,209 | 8% |
| EBITDA (Rs cr) | 246 | 263 | 259 | 195 | 219 | 238 | -0.6% |
| Net Profit (Rs cr) | 166 | 177 | 156 | 92 | 111 | 131 | -5% |
The sales of the company have grown, but slowly, at a compound rate of about 8% in the last five years, from Rs 813 cr in FY21 to Rs 1,209 cr in FY26. For FY26, the company has reported provisional revenue of around Rs 1,206 cr, up 12%, with exports of about Rs 85 cr and titanium production up 40%.
The EBITDA has moved in the negative territory, in the same period, from Rs 246 cr to Rs 238 cr, and it is still below its FY22 peak of Rs 263 cr.
As for the net profits, the company’s figures have fallen at a compound rate of about 5% a year, from Rs 166 cr in FY21 to Rs 131 cr in FY26. It peaked at Rs 177 cr in FY22, crashed to Rs 92 cr in FY24, and has only partly recovered since.
The reasons are visible on the balance sheet. MIDHANI has been spending heavily, with fixed assets jumping from about Rs 429 cr in FY21 to around Rs 1,074 cr in FY25, which lifts depreciation, and it carries roughly Rs 350 cr of borrowings, which adds interest. The squeeze shows up in returns.
The company’s ROCE (return on capital employed) has slid from 21% in FY20 to about 11% in FY25, and its ROE is down to around 8%. In plain terms, for every Rs 100 of capital, MIDHANI now earns about Rs 11, down from Rs 21 five years ago, and well short of the roughly 26% the wider industry manages per Trendlyne
The ownership pattern carries its own warning. The government has stayed put at 74%, but domestic institutions (DIIs) have trimmed their stake from about 18.6% at the time of listing to around 7.8% by March 2026, while public and retail holding has climbed from roughly 7% to nearly 17%. When the professionals quietly step back and the public steps in, it is a pattern worth watching.
Assessing the Premium: Is a 60x Multiple Justified for a Flat Earnings Moat?
The share price of MIDHANI was around Rs 190 in June 2021 and as of closing on 29th May 2026 it was Rs 421, which is a jump of 122% in 5 years.
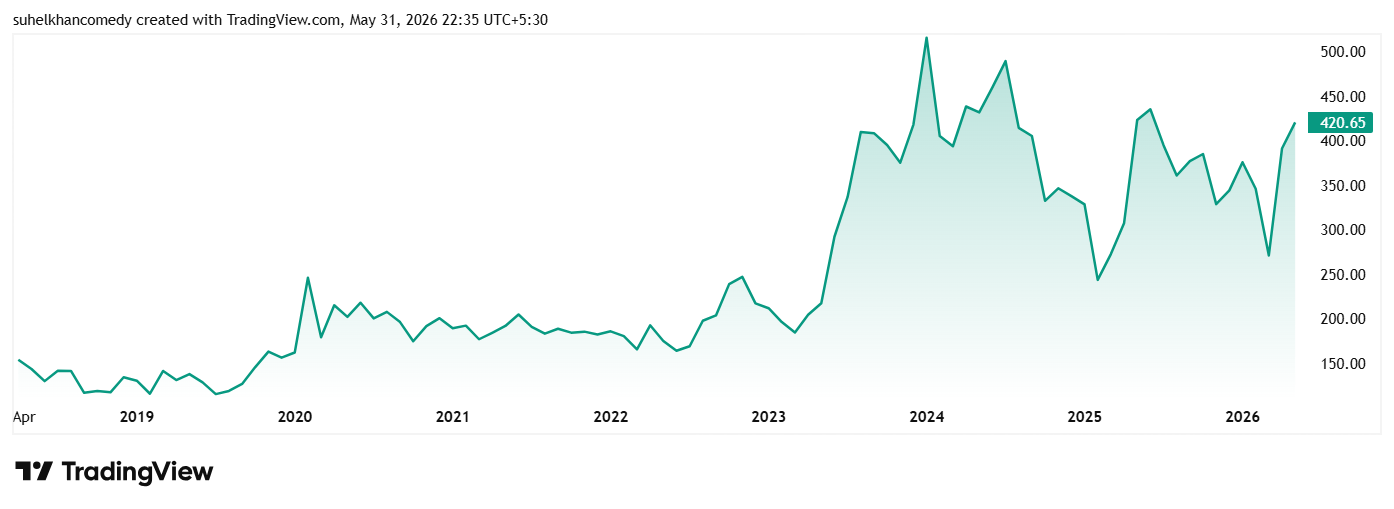
Over five years, the share has compounded at about 15% a year, and about 23% over three years as per Screener, even as profit went backwards. That gap is the whole story. The price has re-rated on the defence and space theme far faster than the earnings have grown.
Regarding valuations, MIDHANI’s share is trading at a PE of about 60x, against an industry multiple of about 53x. Its own five-year average closer to 51x. On every available yardstick, then, the stock looks fully priced.
A near-monopoly on strategic metals, backed by a sovereign owner, is a rare thing. But a moat is not the same as a return. MIDHANI’s profits have drifted sideways to down for five years while its multiple has climbed. The bull case rests on the FY26 revenue bounce turning into fatter margins as titanium volumes rise. Until that shows up in the net profit line, investors are paying a growth price for flat earnings.
Institutional Realism vs Retail Euphoria: The Indian Space Watchlist
While SpaceX may be unreachable for many, India’s listed space and defence supply chain is not, and both Paras and MIDHANI sit right inside it. Neither, however, is a cheap secret. The market has already noticed both, and the share prices show it.
Paras is the genuine grower, with revenue compounding 27% and profit about 41% over five years, and a true niche in optics and protection. The catch is its valuation and a large pile of cash stuck in receivables. MIDHANI is the strategic monopoly, irreplaceable and government-owned, the only titanium-alloy maker in the country. The catch is that its profits have fallen while its multiple has not. One asks you to trust the growth. The other asks you to trust the turnaround.
The lesson from the numbers is the one the SpaceX hype tends to forget. A great mission is not the same as a great investment. The rockets may well scale. Whether the returns scale with them depends on far more boring things: order conversion, margins, and the price you pay to get in. The best way to find out is to add both to a watchlist and watch the next few quarters closely.
Disclaimer:
Note: We have relied on data from http://www.Screener.in and http://www.trendlyne.com throughout this article. Only in cases where the data was not available, have we used an alternate, but widely used and accepted source of information.
The purpose of this article is only to share interesting charts, data points and thought-provoking opinions. It is NOT a recommendation. If you wish to consider an investment, you are strongly advised to consult your advisor. This article is strictly for educative purposes only.
Suhel Khan has been a passionate follower of the markets for over a decade. During this period, he was an integral part of a leading Equity Research organisation based in Mumbai as the Head of Sales & Marketing. Presently, he is spending most of his time dissecting the investments and strategies of the Super Investors of India.
Disclosure: The writer and his dependents do not hold the stocks discussed in this article.
The website managers, its employee(s), and contributors/writers/authors of articles have or may have an outstanding buy or sell position or holding in the securities, options on securities or other related investments of issuers and/or companies discussed therein. The content of the articles and the interpretation of data are solely the personal views of the contributors/writers/authors. Investors must make their own investment decisions based on their specific objectives, resources and only after consulting such independent advisors as may be necessary.