
")
Every business starts with a seed of ambition, sometimes it is just a few thousand rupees, but the dream is always bigger. Every entrepreneur envisions building something that not only survives but thrives, one day finding its place among India’s most admired listed companies.
One such remarkable journey belongs to Eternal Ltd, the company most of us knew for years as Zomato. Founded in 2008 by Deepinder Goyal and Pankaj Chaddah as Foodiebay, it began as a simple restaurant discovery platform.
An idea born from a common problem of “where to eat,” would one day grow into a household name for food delivery across India.
Fast forward, Eternal Ltd has achieved what many consider phenomenal; a market cap of Rs. 3,24,783 crore. It now sits proudly at 21st rank in Nifty50, surpassing legacy giants like Tata Motors, Titan, Bajaj Auto, Wipro, Tech Mahindra, Eicher Motors, Hero Motocorp, and even Tata Steel.
Can it aspire to touch a Rs. 10 lakh crore valuation, securing a spot among the top five Indian companies?
An unfolding story in the charts
While fundamentals drive the long-term story, sometimes charts tell us more than words ever could. And the chart structure of Eternal Ltd is whispering something exciting, it may potentially be on its way to a Rs. 7,00,000crore+ market cap.
- The Point & Figure Chart
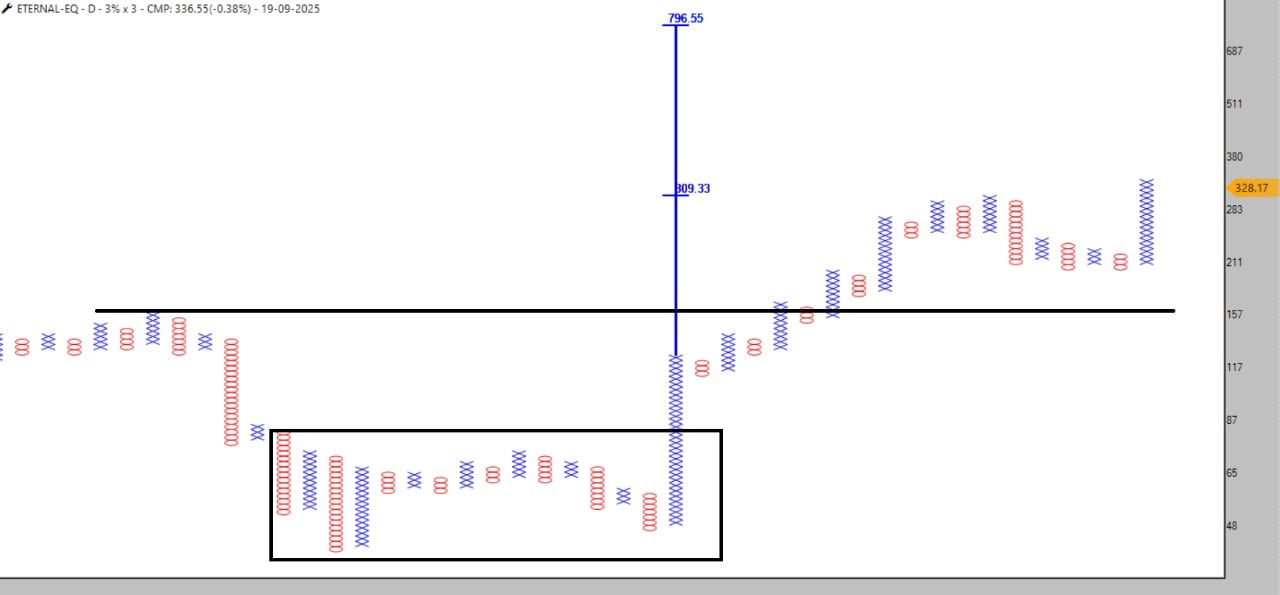
On the daily 3% X 3 Point & Figure (P&F) chart, Eternal Ltd has given a powerful signal. The bullish anchor column, marked by a series of 15 Xs, shows that the bulls have taken control of the narrative.
The beauty of Point & Figure lies in its ability to cut out the noise. And when we zoom into the base built during 2022–2023, between Rs. 40 and Rs. 140, the story gets even more compelling. That was the period when the smart money accumulated quietly, preparing for the next leg rally.
The horizontal and vertical counts of this consolidation, spread across nearly 18 columns, point towards a target zone of Rs. 796. If the price does indeed march towards this level, Eternal Ltd’s market cap would comfortably cross Rs. 7,50,000 crore, a milestone that pushes it much closer to India’s elite club of mega caps.
- The Weekly Candlestick Chart
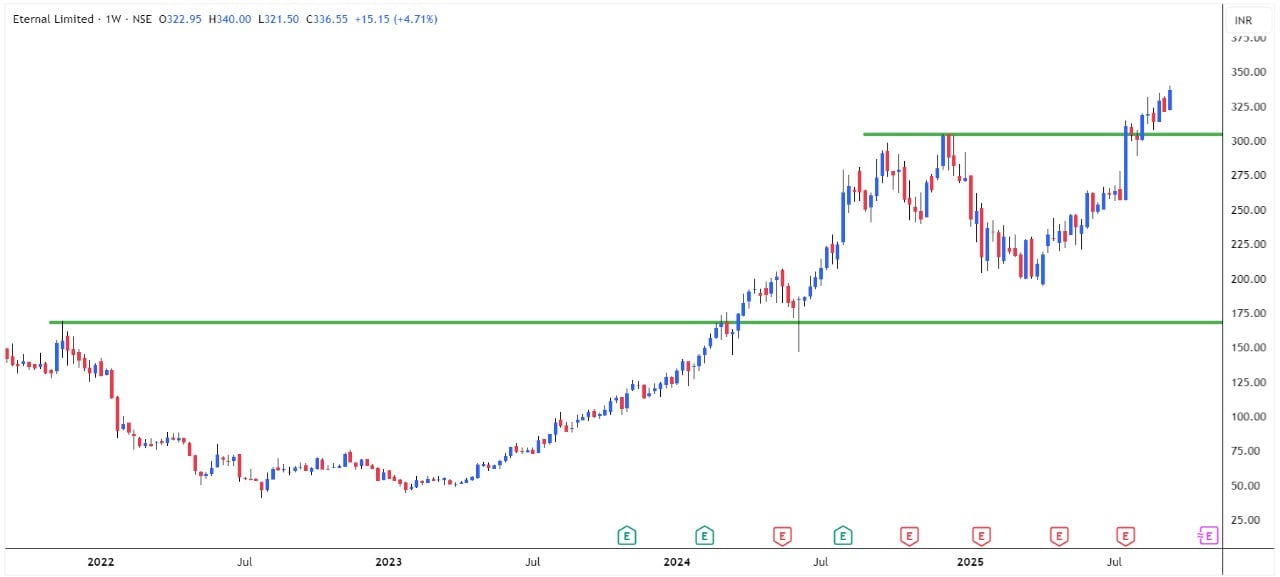
When we look at the weekly candlestick chart, there’s déjà vu. The stock has broken out of a U-shaped consolidation, trading now at all-time highs. Long-term investors know that these breakouts often lead to uncharted territory, where the stock writes a fresh story.
We saw this before. When Eternal Ltd broke out of its rounding bottom pattern at Rs. 175, there was no turning back and the price never looked over its shoulder. The current breakout feels eerily similar. History may not always repeat, but in markets, it often rhymes.
From startup to superpower?
Can Eternal Ltd Join the Elite?
The dream of a Rs. 10 lakh crore market cap may sound ambitious, but hasn’t Eternal Ltd’s journey always been about defying expectations?
From a small startup in 2008 to competing with India’s most trusted conglomerates in 2025, the company has constantly redefined what’s possible.
Of course, such journeys aren’t straight lines. Stocks move in waves. There will be corrections, there will be phases of consolidation. But the bigger picture suggests Eternal Ltd is no longer just a “food delivery app stock”, it’s a market leader in the making.
Investors who believe in long-term wealth creation often look back at such moments with pride. Imagine being part of Infosys in the 1990s, or Reliance Industries in the early 2000s. Eternal Ltd’s charts today hint that we may be looking at a similar inflection point. The view for long-term investors remains optimistic.
Disclaimer:
Note: The purpose of this article is only to share interesting charts, data points and thought-provoking opinions. It is NOT a recommendation. If you wish to consider an investment, you are strongly advised to consult your advisor. This article is strictly for educative purposes only.
Kiran Jani has over 15 years of experience as a trader and technical analyst in India’s financial markets. He is a well-known face on the business channels as Market Experts and has worked with Asit C Mehta, Kotak Commodities, and Axis Securities. Presently, he is Head of the Technical and Derivative Research Desk at Jainam Broking Limited.
Disclosure: The writer and his dependents do not hold the stocks discussed here. However, clients of Jainam Broking Limited may or may not own these securities.
The website managers, its employee(s), and contributors/writers/authors of articles have or may have an outstanding buy or sell position or holding in the securities, options on securities or other related investments of issuers and/or companies discussed therein. The content of the articles and the interpretation of data are solely the personal views of the contributors/ writers/authors. Investors must make their own investment decisions based on their specific objectives and resources, and only after consulting such independent advisors if necessary.