")

Following eight consecutive sessions of market correction, traders and investors saw a relief rally that is expected to continue. Historically, similar conditions have delivered at least a 2% return within a month. The recent correction was primarily due to global concerns about U.S. tariffs. Right now, the Nifty IT index looks good in terms of risk and reward near important support levels.
Technical charts show that Indian IT stocks, especially Tata Consultancy Services (TCS) and Oracle Financial Services (OFSS), are doing well. Both stocks look like they have good chances of doing well because their fundamentals are strong and their technical indicators are positive.
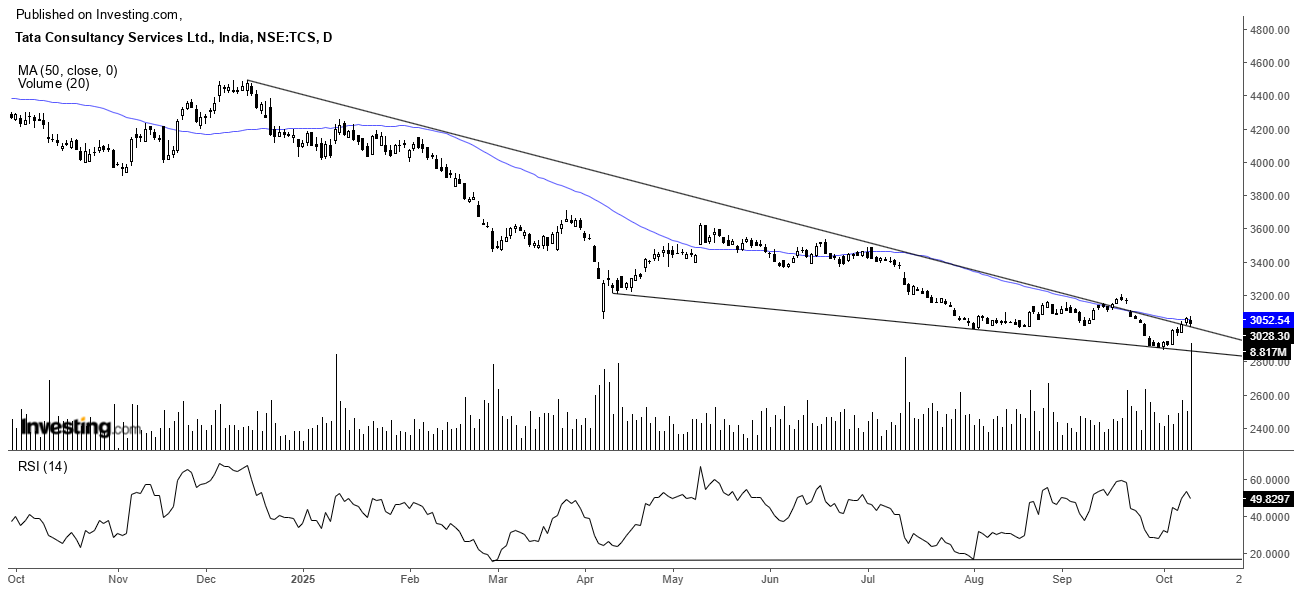
TCS: Bullish reversal breakout
The stock began its decline in January 2025, falling from a peak of ₹4,500 and losing 36% of its value over the next ten months. By October 2025, it found support along a downward trendline and has recently broken out of a falling wedge pattern.
Currently, the stock is trading above its 50-day moving average, which usually signals the start of an uptrend. Also, the 14-period RSI is moving into bullish territory and showing a bullish divergence. All of these signals together suggest that the stock’s momentum may be getting better.
Key TCS’s potential signs of reversal
- Bullish falling wedge pattern: The stock has broken out of a falling wedge, which is a strong sign of bullish reversal.
- 50 Day Moving Average: The stock price is now above its 50-day moving average, which is a start of an uptrend.
- Breakout with Volume: The price is going up along with higher trading volume, which shows that the market sentiment bullish.
- RSI & 3 bar divergence: The 14-period RSI is close to the 50 mark and has also formed a 3-bar positive divergence.
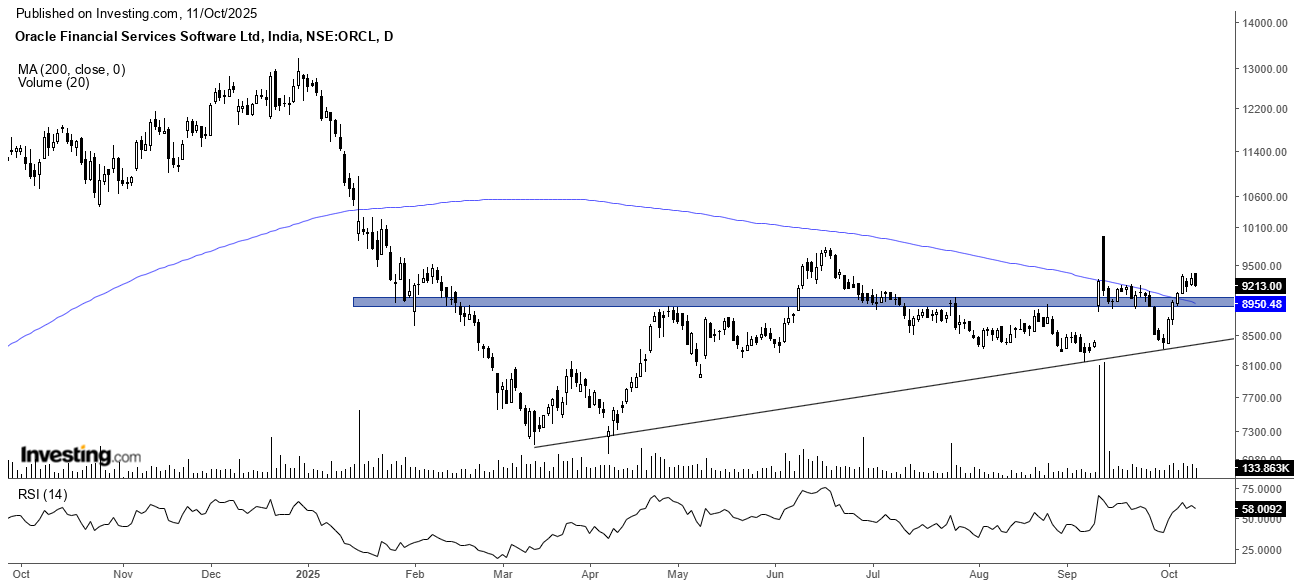
OFSS: Bullish consolidation pattern breakout
Price of OFSS shares dropped down from ₹13,220 to ₹7,040 in the period from December 2024 to April 2025 but went back up to ₹9,200 in June, which is a rise of 33%. The fact that the stock has made such a quick recovery is a sign of its resilience & strong investor support.
After this jump, OFSS made an ascending triangle and is now above important resistance points as well as its 200-day moving average. 14 period RSI is still in the bullish zone, which means that there is still a lot of positive momentum. Technical situation is supportive of price increase in short term.
OFSS’s Stock reversal analysis
- Ascending triangle pattern breakouts: The price has broken out from the ascending triangle pattern and has successfully retested.
- Volume Surge Confirming the Breakout: The decline in price was accompanied by lower volumes, while the subsequent price increase has been supported by a notable increase in volume, underscoring strong investor conviction.
- 200 Day Moving Average: The stock is trading above its 200-day moving average, reinforcing the strength and sustainability of the current upward trend.
- RSI & Price Direction: The 14-period RSI remains above the 55 level, clearly signalling strong and sustained bullish momentum in the stock.
Final Take
From both a technical and structural perspective, Indian equities are well-positioned.
The broader Indian IT sector stocks remains cautious due to U.S. tariff concerns. Having said that industry leaders such as TCS and OFSS have decisively broken key critical moving averages.
Disclaimer:
Note: The purpose of this article is only to share interesting charts, data points and thought-provoking opinions. It is NOT a recommendation. If you wish to consider an investment, you are strongly advised to consult your advisor. This article is strictly for educative purposes only.
Kiran Jani has over 15 years of experience as a trader and technical analyst in India’s financial markets. He is a well-known face on the business channels as Market Experts and has worked with Asit C Mehta, Kotak Commodities, and Axis Securities. Presently, he is Head of the Technical and Derivative Research Desk at Jainam Broking Limited.
Disclosure: The writer and his dependents do not hold the stocks discussed here. However, clients of Jainam Broking Limited may or may not own these securities.
The website managers, its employee(s), and contributors/writers/authors of articles have or may have an outstanding buy or sell position or holding in the securities, options on securities or other related investments of issuers and/or companies discussed therein. The content of the articles and the interpretation of data are solely the personal views of the contributors/ writers/authors. Investors must make their own investment decisions based on their specific objectives and resources, and only after consulting such independent advisors if necessary.