



Riding on India’s Defence Supremacy
There is a certain thrill in watching a defence stock double, then double again. Over the last year, India’s defence capabilities have been one of the loudest stories in the market, and a fresh wave of retail investors has piled in chasing the next big winner. Two names stand out for the sheer size of their move.
One of them has risen about 120% in a single year. The other has climbed over 400%. On a price chart, both look like dream trades. But a rising price tells you what the market hopes for, not always what the business is actually doing. And that gap is exactly where careful investors make, or lose, their money.
So, I went back to the numbers to ask a simple question. After gains this big, is there still road left, or has the run already run its course? Let us dig into both stocks and find out.
Apollo Micro Systems: A Real Business That Has Gotten Expensive
Incorporated in 1985, Apollo Micro Systems Ltd designs, builds, and tests electronic and electro-mechanical systems for the defence sector. In plain terms, it makes the brains and moving parts that go inside India’s weapons.
With a current market cap of Rs 14,624 cr, the company supplies mission-critical hardware across missiles, satellite and space systems, naval systems, avionics and homeland security. As per its own filings, it carries over 700 on-board technologies and works on more than 150 indigenous programs. That is a deep, sticky position in a sector the government is determined to make at home rather than import.
Why Apollo’s Numbers Look Genuinely Strong
Unlike a lot of hot stocks, Apollo is backed by a business that is actually growing.
| Financial Year | FY21 | FY22 | FY23 | FY24 | FY25 | FY26 | 5Yr CAGR |
| Sales (Rs Cr) | 203 | 243 | 298 | 372 | 562 | 904 | 35% |
| EBITDA (Rs Cr) | 39 | 46 | 64 | 84 | 129 | 218 | 41% |
| Net Profit (Rs Cr) | 10 | 15 | 19 | 31 | 56 | 107 | 61% |
The sales of the company have grown at a compound rate of 35% over five years, from Rs 203 cr in FY21 to Rs 904 cr in FY26.
The EBITDA (earnings before interest, taxes, depreciation and amortisation) tells a similar story. It compounded at about 41%, from Rs 39 cr in FY21 to Rs 218 cr in FY26, with operating margins jumping to 24%.
The net profits have grown the fastest of all, at a compound rate of 61% over five years, from Rs 10 cr in FY21 to Rs 107 cr in FY26.
The order pipeline has helped the story along. In April 2026, Apollo said it had received a lifetime licence to manufacture missiles, anti-tank guided missiles, torpedoes, aerial bombs and loitering munitions, a rare and valuable permission. Days earlier, it had completed blast trials of Limpet Mines for the Indian Navy. These are the kind of headlines that keep a defence stock in the spotlight.
The Triple Digit Gain and Valuation Question: How Much Is Already in the Price?
The share price of Apollo Micro Systems was around Rs 12 in June 2021 and as on 3rd June 2026 it was Rs 409, which is a jump of over 3,300% in 5 years.
Apollo Micro Systems Long Term Price Chart
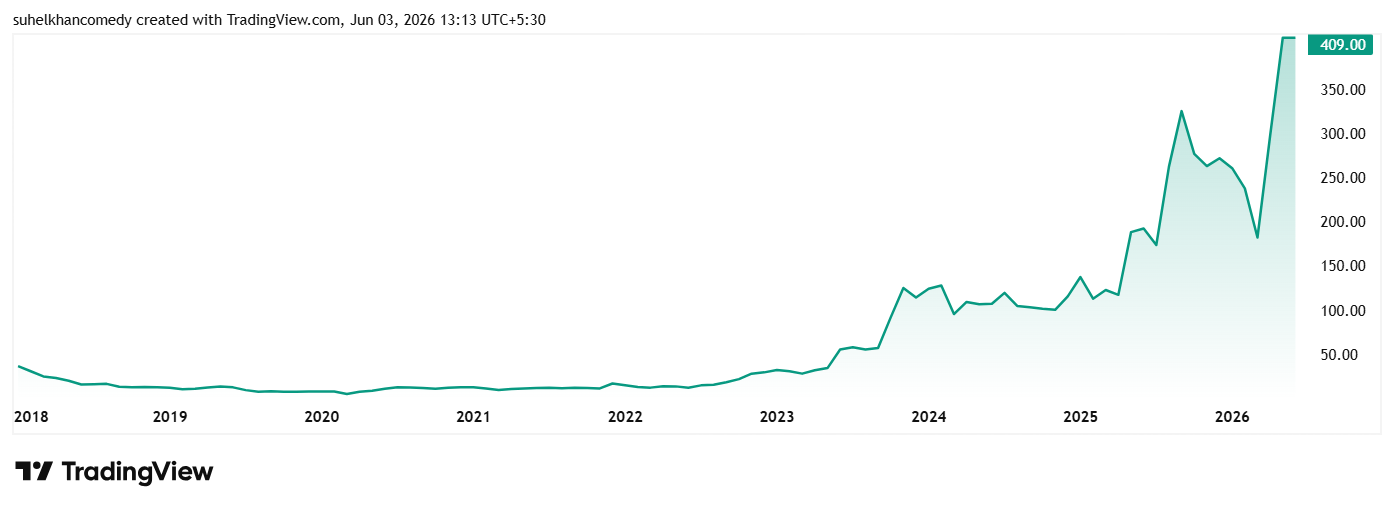
In the last 1 year itself, the share has logged gains of over 120%. It is now trading at 11 times its book value, which means buyers are paying almost Rs 11 for every one Rs of net assets on the balance sheet. Over last 3 years, the stock has compounded at close to 133% a year. That is something one can call a spectacular run.
Looking at the valuations, Apollo is currently trading at a price-to-earnings (PE) ratio of 130x and the current industry median is 59x times. The Nifty India Defence index, by contrast, trades at roughly 57 times, as per Trendlyne. In other words, Apollo is priced at about double the wider defence pack, even before you compare it with the broader market.
A few red flags deserve an honest mention. Promoters have pledged about 40% of their holding, meaning a large chunk of their shares is parked as collateral against borrowings. The company’s debtors stretch to 194 days, and its cash conversion cycle, the time taken to turn money spent into money collected, has run well above a year, which is heavy on working capital. Free cash flow has also been negative in recent years as the firm spends to grow.
But none of this breaks the story. Apollo is a real, scaling defence supplier with strong order wins. But at 130 times earnings, the market is already pricing in years of flawless execution. The business may keep delivering; the valuation simply leaves very little room for disappointment.
Sigma Advanced Systems: A 400% Run Built on What, Exactly?
Incorporated in 1999, Sigma Advanced Systems Ltd is a Hyderabad-based aerospace and defence manufacturer. Long-time investors will know it by its older name, Megasoft, a company that once sat in pharma and software before reinventing itself for the defence age.
With a current market cap of Rs 7,699 cr, Sigma is a much smaller and far younger defence player than Apollo. It provides end-to-end solutions for defence PSUs and caters to the requirements of the Army, Navy and Airforce, collectively known as the Tri Services. It also provides solutions to Ministry of Home Affairs and Para Military services.
The Defence Pivot Paying Off
This is the part every investor should slow down and read twice. On the surface, Sigma reported a net profit of Rs 268 cr in FY26. That sounds wonderful for a company this size. But dig one layer down and the picture changes.
Over the same period, the company’s operating profit was actually negative, at about minus Rs 10 cr. The reported profit was carried almost entirely by “other income” of around Rs 208 cr, and the bulk of that came from a single one-off gain of roughly Rs 187 cr booked in the June 2025 quarter. Strip that one-time item out, and the core business was not making money.
The revenue story is just as unusual. The legacy business shrank to almost nothing before the defence pivot took hold. Take a look:
| Financial Year | FY21 | FY22 | FY23 | FY24 | FY25 | FY26 |
| Sales (Rs Cr) | 59 | 52 | 2 | 0 | 0 | 492 |
| EBITDA (Rs Cr) | 4 | -18 | -18 | -9 | -10 | 48 |
| Net Profit (Rs Cr) | 2 | 5 | 9 | -13 | -30 | 268 |
You will notice something the templates usually carry is missing here: a clean five-year compound growth figure. That is deliberate, and honest. Screener leaves Sigma’s five-year sales and profit CAGR blank, because you simply cannot compound a number that fell to zero and then sprang back to life.
On the surface, Sigma reported a compressed operational Profit Before Tax Rs 198 cr in FY26, which is a huge jump due to the Defense pivot starting to pitch in.
A CAGR here would be a made-up number dressed up as fact, so I will not write one. The real signal is in the quarters: sales were Rs 18 cr in September 2025 and then jumped to Rs 146 cr in December 2025 and Rs 323 cr in March 2026 as the new defence orders began to flow. The turnaround is real, but it is only a couple of quarters old.
Surging Corporate Control & Fresh Export Mandates
The share price of Sigma was around Rs 11 in June 2021 and as on 3rd June 2026 it was Rs 437, which is a jump of over 3,870% in 5 years.
Sigma Advanced Systems Long Term Price Chart
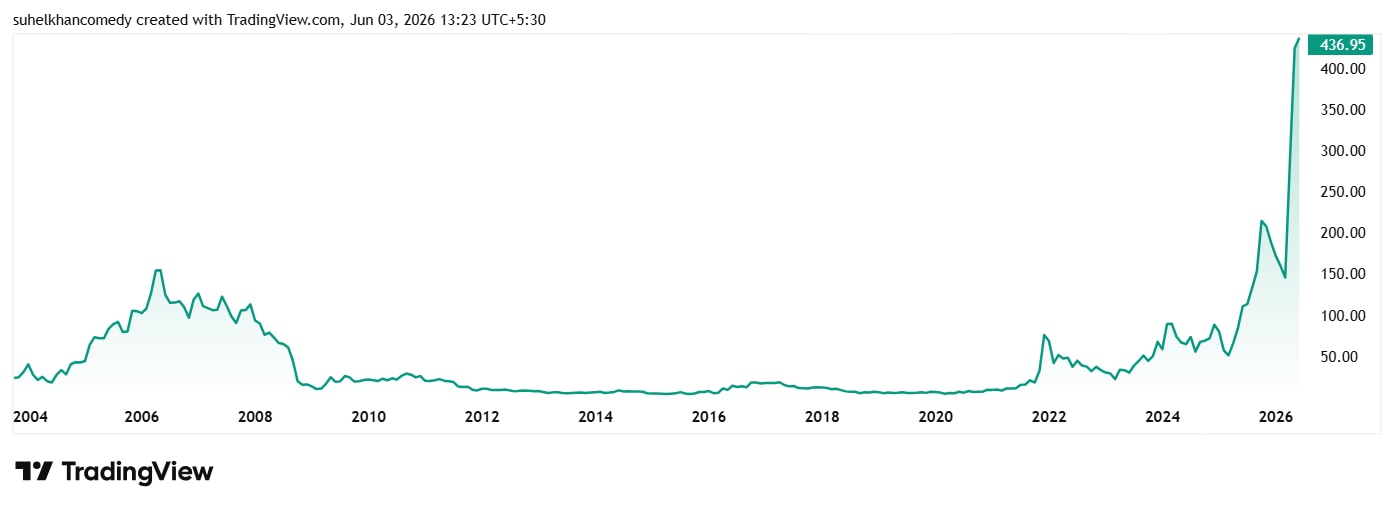
But just like the financials, the stock prices for the last 5 years hold less importance. What has to be noted is the growth logged after the company pivoted to defense. In the last 1 year, the stock prices have jumped by 400%.
Before we go to the valuation, two things one must know. First, in March 2026, promoter holding leapt from 35% to 71% in a single quarter, a major show of commitment from the people running the show. Second, in May 2026, the company announced a USD 11.4 Mn export order, worth about Rs 107 cr, to supply 90,000 filled fuzes. For a company that was reporting near-zero sales not long ago, an export order of that size is a genuine vote of confidence.
But the valuation still asks a lot. Sigma trades at 16 times its book value. The current PE of the share is 28x and the industry median is 59x. In short, the price has already raced ahead to greet a recovery that the operating results are only just beginning to show.
Is the Run Over: The Divergent Paths of Defence Winners
The big question now is if the run is over? The honest answer is that these two stocks now sit on very different ground.
Apollo Micro Systems has the stronger case. It is a real, growing defence business with rising sales, expanding profit and a fat order book. Its problem is not the business but the price tag. At 130 times earnings, perfection is more or less assumed, and any stumble could sting.
Sigma Advanced Systems is the higher-risk bet of the two. The promoter buy-in and the fresh export order are real positives, but the headline profit leans on a one-off gain, the operating engine is barely a quarter into its recovery, and the stock has already priced in a lot of hope.
Defence remains one of the strongest structural themes in the Indian market, and both these companies are plugged into it. But after gains of this size, the margin of safety has thinned considerably. The next few quarters of actual order delivery, not press releases, will decide whether the run continues or pauses for breath.
A smart way to not miss out on any big movements in these stocks is to add them to a watchlist and keep a vigilant eye on them.
Disclaimer:
Note: We have relied on data from http://www.Screener.in and http://www.trendlyne.com throughout this article. Only in cases where the data was not available, have we used an alternate, but widely used and accepted source of information.
The purpose of this article is only to share interesting charts, data points and thought-provoking opinions. It is NOT a recommendation. If you wish to consider an investment, you are strongly advised to consult your advisor. This article is strictly for educative purposes only.
Suhel Khan has been a passionate follower of the markets for over a decade. During this period, He was an integral part of a leading Equity Research organisation based in Mumbai as the Head of Sales & Marketing. Presently, he is spending most of his time dissecting the investments and strategies of the Super Investors of India.
Disclosure: The writer and his dependents do not hold the stocks discussed in this article.
The website managers, its employee(s), and contributors/writers/authors of articles have or may have an outstanding buy or sell position or holding in the securities, options on securities or other related investments of issuers and/or companies discussed therein. The content of the articles and the interpretation of data are solely the personal views of the contributors/ writers/authors. Investors must make their own investment decisions based on their specific objectives, resources and only after consulting such independent advisors as may be necessary.