

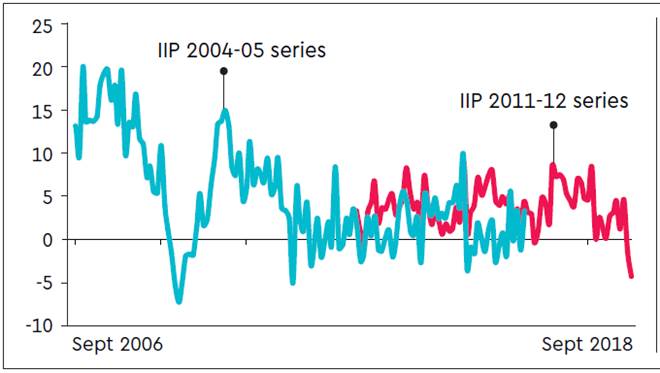
The September growth rate of the Index of Industrial Production (IIP) was –4.3%, fairly headline hogging. Although such a performance was anticipated to an extent, it still serves to draw attention to the depth of the manufacturing slowdown (the August growth rate was also was revised further down, from –1.1% to –1.4%). This is the deepest negative growth in the 2011-12 series (see graphic); even in the previous 2004-05 IIP series, such sharp slowdowns were relatively rare. What should we make of this?
A little context is needed. In mid-October, the IMF had revised India’s FY20 GDP growth forecast from 7% (July 2019 update) to 6.1%, a very large –0.9 percentage-point cut, indicative of the element of surprise in the recent growth deceleration (the growth outlook for most other countries had been cut by more modest 0.1-0.2 ppt). In August, the other data point, which had highlighted the extent of the slowdown, was the 5% GDP growth print for Q1 FY20, down from the already tepid 5.8% growth in Q4 FY19. This slowdown had emanated almost entirely from the manufacturing segment, underscoring the sector as the main driver of the slowdown.
The proximate sources of the September IIP slowdown were mining, (growth contracting 8.5%) and electricity generation (growth contracting 2.6%). This can be attributed to the excess, prolonged rains in the mining belts, and is likely to be transient. There is also some indication that the negative growth in petroleum refining might have been due to some maintenance related refinery closures, but more on this later. However, the weakness is quite broad-based, even in consumer non-durables (FMCG); this is probably representative of squeezed purchasing power, and, hence, demand weakness. The patterns of the individual industries in the manufacturing segment, which accounts for the bulk of the slowdown given its large weight in the IIP are, however, illustrative.
IIP growth would have been even weaker had it not been for a couple of sectors where high growth got concentrated. The contributions of a few selected industries is given in the accompanying graphic. Basic metals grew 9.2%, driven largely by Mild Steel (MS) Slabs, contributing 1.6% to the IIP performance; growth in pretty much every other segment was negative. MS Slabs are used in the hydraulic press and machinery industry. This largely explains the 7% growth in the intermediate goods user industry segment, which some analysts have used to predict imminent end-use output recovery.
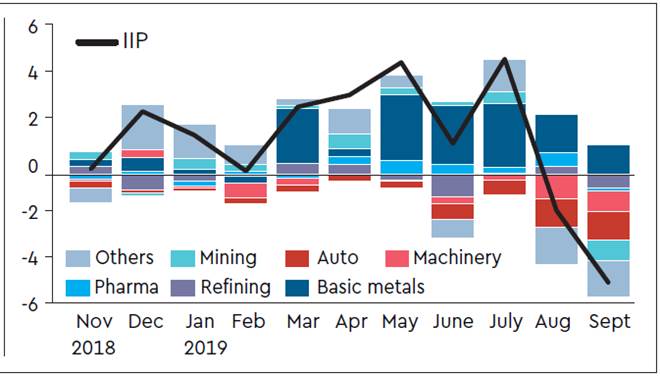
Unfortunately, as the accompanying graphic also shows, basic metals has been a pretty consistent growth driver for the IIP since March 2019, and this was largely due to high growth in the MS Slabs; yet, there is still little evidence of a recovery of machinery equipment (capital goods), which might then be seen in the end-use consumer goods segments.
The slowdown is also showing signs of spillover into the broader ecosystem of economic activity, which envelopes manufacturing. The sharp IIP de-growth was, in large part, due to a persistent negative growth in capital goods, driven by commercial vehicles (CVs), which have had an average de-growth of 24% in April-September FY20. Diesel sales, on the other hand, had an average growth of 1% in these six months, indicating that commercial transport activity had slowed much less. However, a continuing vehicle sales slowdown will inevitably impact transport activity down the line. Diesel consumption has sharply decelerated in August and September.
All of this does not augur well for Q2 GDP growth, which will be likely come in at below 5%. Recall that the Q1 FY20 slowdown was largely led by manufacturing, and a turnaround would have determined the quantum of recovery. Unfortunately, Q2 average IIP growth averaged –0.4% vs 3.0% in Q1. Moreover, given that GDP estimates are based on value added more than volumes, initial Q2 results of manufacturing companies show a very sharp contraction of operating profits, which suggests that GVA manufacturing growth might be significantly lower than the 0.6% growth in Q1.
IIP is unlikely to have recovered in October, although this is an artefact of the IIP inputs. The IIP prints during the September-November months present a distorted picture in the individual months due to the festival-day schedule for Dussehra and Diwali, which vary during these months, year to year. Last year, FY19, for instance, Diwali was in November, leading to a production surge and stocking in October, with an 8.4% print, which will inevitably lead to a deep continuing negative this year. This year, FY20, the festive days were in October, so the output surge would have been in September, despite which we get the -4.3% print. There was also one additional working day in September, which should have bumped up growth; on the other side, this also means that inter alia, November IIP growth might be quite strong.
The design of an optimal mix of policies to reverse this deceleration needs to be thought through in detail. The scope for a strong monetary policy response is limited. We forecast a jump in October CPI inflation to 4.4%, although entirely from high food and vegetable prices, which has continued into the first week of November. If this pattern is maintained, we will get an even higher print for November, which will present a quandary for the MPC meeting to review the repo rate and other measures in early December.
(The writer is Senior Vice President Business and Economic Research, Axis Bank. Views are personal. With contributions from Vikram Chhabra.)