")

In a week when geopolitical tensions rattled global sentiment, the Indian stock markets mirrored global nervousness. The Nifty50 slipped into the red, ending the week at 24,718, down by 1.14%. Bulls that charged in early were soon tempered by reality, as war clouds between Iran and Israel began to cast a long shadow across global financial markets. The echoes of the India-Pakistan conflict still lingered, but this latest escalation has added fuel to a growing sense of uncertainty.
Markets globally were not spared either. The Dow Jones Industrial Average fell sharply, shedding 769 points to close at 41,197 on Friday, as investors rotated out of equities into commodities like crude oil, natural gas, and gold. In this risk-off environment, equities may struggle for direction in the near term.
Yet even amidst such volatility, pockets of opportunity are emerging, particularly in India’s power sector. Two stocks, JP Power Ventures and Suzlon Energy, have caught the market’s attention after technical breakouts on the daily charts, signalling possible accumulation zones for investors.
JP Power
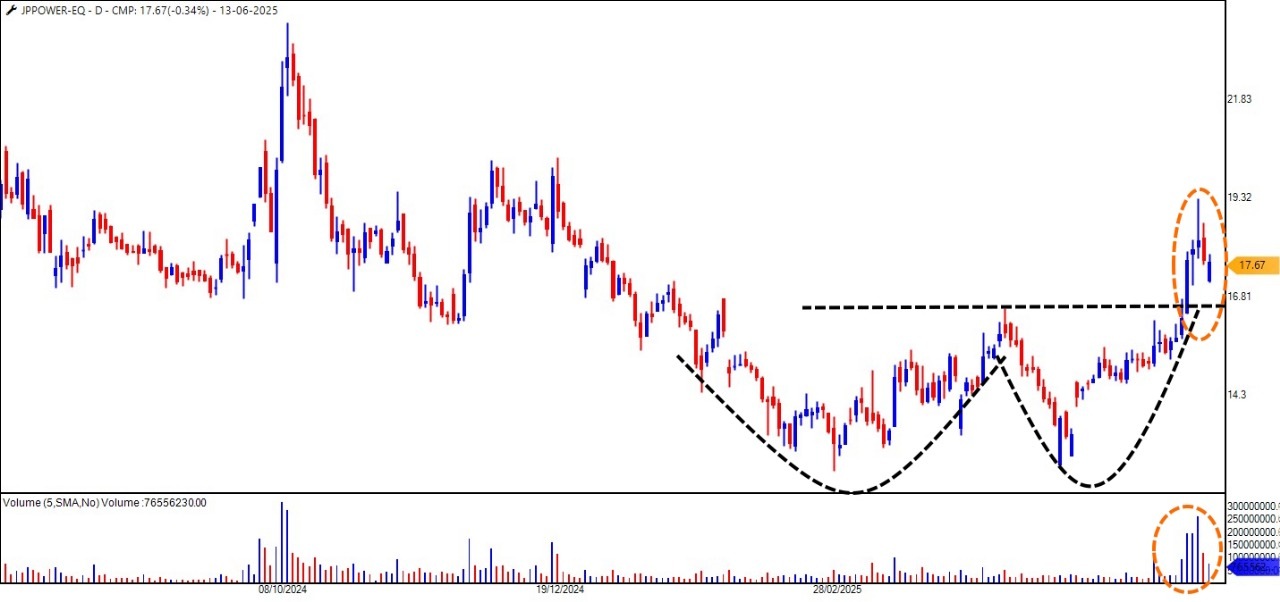
Jaiprakash Power Ventures Ltd. (JP Power) is a part of the Jaypee Group, a diversified infrastructure conglomerate with interests in engineering, construction, power, cement, and real estate. JP Power focuses on thermal and hydroelectric power generation and plays a key role in India’s growing need for sustainable energy infrastructure.
Source: TradePoint, Definedge
On the daily chart, JP Power has staged a breakout from a Double Bottom pattern, a classic bullish reversal signal. The formation of this base suggests that selling exhaustion is complete, and buyers may now be in control.
The strong surge in volume during the breakout adds conviction, often seen as a sign of institutional interest. The neckline, previously a resistance level, has now turned into support. A retest of this neckline could present a potential buy-on-dips opportunity for bulls looking to position ahead of a potential upward leg.
Suzlon Energy
Suzlon Energy is a leading renewable energy solutions provider, known for its robust presence in the wind power segment. With operations in over 18 countries and a strong domestic manufacturing base, Suzlon remains a key player in India’s transition to green energy.
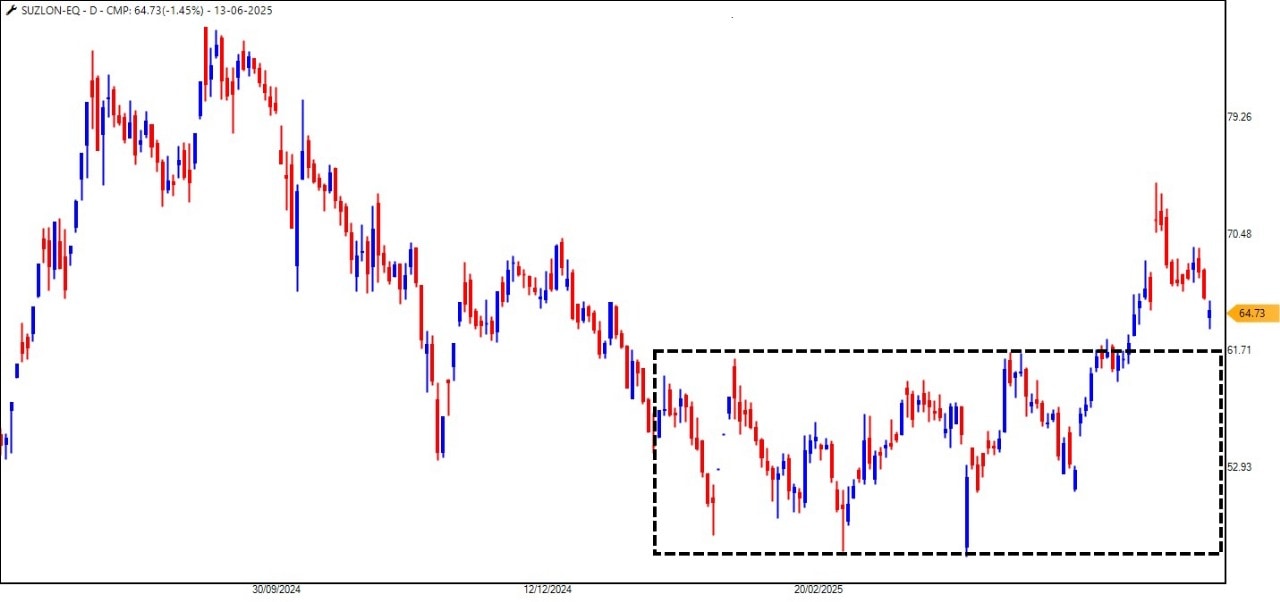
After hitting a 2024 high of Rs. 86.04, Suzlon saw a measured decline, eventually bottoming out at Rs. 46.15. While some may view this as a bearish trend, closer inspection reveals a classic re-accumulation phase, as per Wyckoff Theory.
The Rs. 59-63 zone has emerged as a crucial demand area, where buyers are seemingly stepping back in. This price action suggests that the recent downtrend was more of a consolidation within a broader uptrend. If bulls maintain momentum, Suzlon may potentially be poised for another upward burst.
Market Pulse – The Risk
The war-driven volatility has created a tense atmosphere for equity markets, but it has also created room for rotational plays. While sectors like defence, energy, and commodities may continue to gain favour, technical breakouts like those seen in JP Power and Suzlon indicate that smart money may already be repositioning in high-conviction plays. As these stocks are volatile in nature, the war news can trigger a higher range for the stocks, and investors should keep this in mind before adding to their watchlist.
Disclaimer:
Note: We have relied on data from http://www.definedgesecurities.com throughout this article. Only in cases where the data was unavailable have we used an alternate but widely used and accepted source of information.
The purpose of this article is only to share interesting charts, data points and thought-provoking opinions. It is NOT a recommendation. If you wish to consider an investment, you are strongly advised to consult your advisor. This article is strictly for educative purposes only.
Brijesh Bhatia has over 18 years of experience in India’s financial markets as a trader and technical analyst. He has worked with UTI, Asit C Mehta, and Edelweiss Securities. Presently, he is an analyst at Definedge.
Disclosure: The writer and his dependents do not hold the Stocks discussed in this article. However, clients of Definedge may or may not own these securities.
The website managers, its employee(s), and contributors/writers/authors of articles have or may have an outstanding buy or sell position or holding in the securities, options on securities or other related investments of issuers and/or companies discussed therein. The articles’ content and data interpretation are solely the personal views of the contributors/ writers/authors. Investors must make their own investment decisions based on their specific objectives, resources and only after consulting such independent advisors as may be necessary.