
")
The defence stocks have been the talk of the town for the last 2 years. However, all stocks from the defence sector were in a downtrend or in a correction phase for the past six months; now they are finally showing signs of recovery.
After six months of decline and price correction, defence stocks are poised to be once again the talk of the town. The stocks are positioned favourably and could attract attention from investors as well as traders. With attractive prices and the broader market improving, defence stocks are displaying potential for a turnaround. Garden Reach Shipbuilders and Bharat Dynamics have formed reversal patterns, indicating possible opportunities for investors and traders.
Garden Reach Shipbuilders – A Gearing up for the next Bullish trend
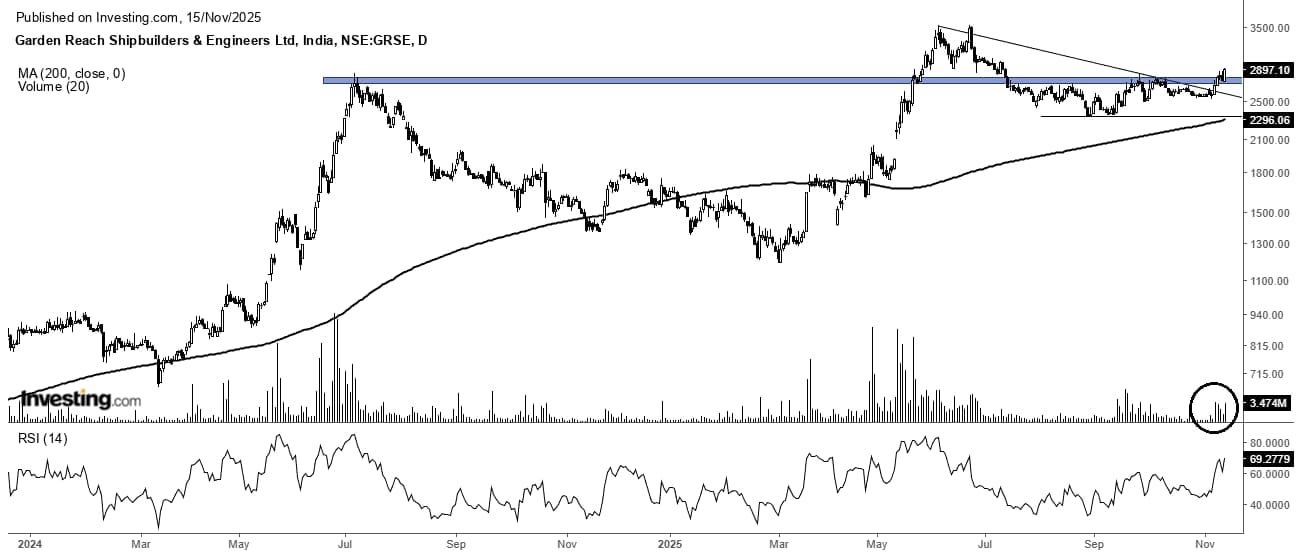
Garden Reach Shipbuilders (GRSE) witnessed a sharp 34% decline from its June 2025 peak of Rs. 3,560, reaching a low of Rs. 2,320. However, the current chart setup now suggests fresh buying interest and the possibility of a trend reversal.
Key Indicators Supporting GRSE’s Strength:
- Multiple Bullish Chart Pattern Breakouts: The stock has broken out of key patterns such as the falling trend line and descending triangle.
- Trading Above 200 SMAs: For the first time since April 2025, the price is trading and staying above its 200-day Simple Moving Averages. This could mean that the trend is about to change.
- Volume Surge Confirming Breakout: When both price and volume move up at the same time, it means that a lot of individuals are interested, which validates the upward trend.
- Strengthening RSI Momentum: A 14-period Relative Strength Index (RSI) over 60 suggests positive divergence and the chance of future increases.
Outlook: Garden Reach Shipbuilders
GRSE delivered an extraordinary 425% return from March 2024 to June 2025. From then, the stock has undergone a price & time correction phase, declining from Rs.3,560 to Rs.2,320 over the past six months.
However, the current chart setup is showing early signs of a potential recovery. The stock has formed bullish reversal patterns, i.e., a falling trendline and a descending triangle. With rising volume, price has also moved above its long-term 200 SMAs after seven months, which is a key signal of accumulation before an upward move. Technical setup shows that GRSE could be poised for a fresh rally.
Bharat Dynamics Limited – Bullish Reverse in Play
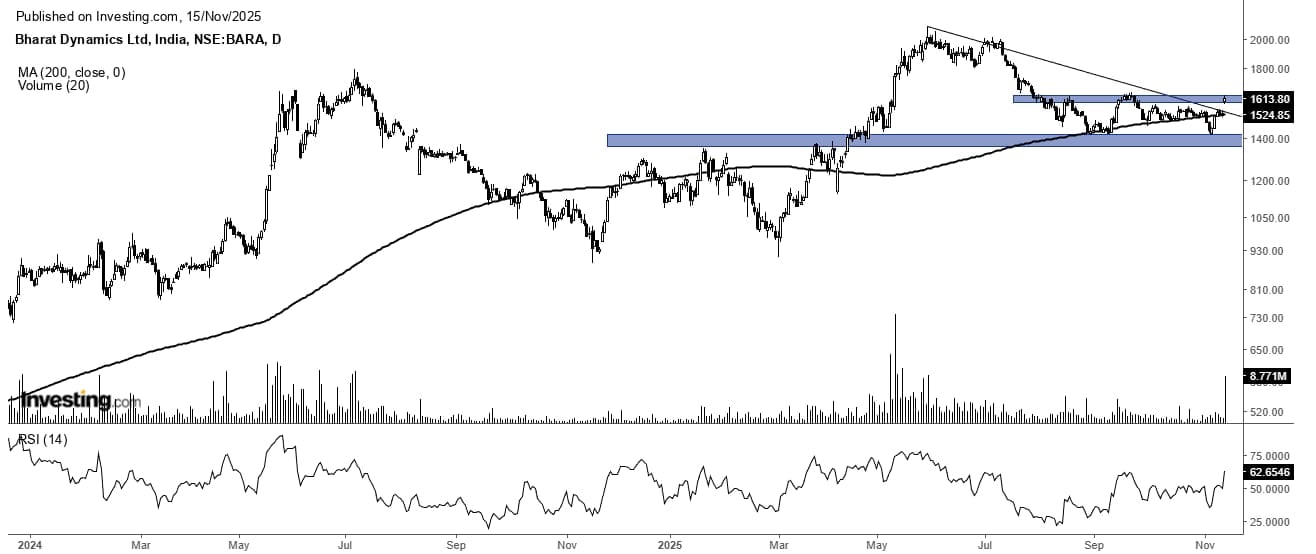
Bharat Dynamics has given a negative return and a decline of approximately 33% from May 2025 to November 2025. The stock was then ready for a significant pullback, as evidenced by daily signs of a fading trend.
Key Indicators Supporting BDL’s Strength:
- Bullish Chart Pattern Breakout: The stock has displayed a strong upward movement by breaking through a descending trendline and a descending triangle pattern, thus making the setup more bullish.
- Volume Surge: An increase in price along with an increase in volume implies a large number of buyers and thus supports the breakout.
- Trading Above 200 SMAs: BDL is currently trading and holding above its 200-SMA for the first time since April 2025, a signal of a possible shift in the trend.
- RSI Gaining Strength: The RSI(14) over 60 indicates momentum up with a possible increase.
Outlook: Bharat Dynamics
It has been a rough half-year for BDL; the price of the stock dropped by almost Rs. 700 from Rs. 2,100 to Rs. 1,410. Nevertheless, the indicators on the technical chart now suggest a possible change in momentum. The technical chart pattern has indicated a potential trend reversal, alongside a breakout from a bearish trend characterised by a falling trendline and a descending triangle pattern. The RSI, alongside the current condition, has shifted into the bullish zone, signalling increasing momentum.
The strong contender
The pullback of powerful reversal chart patterns has begun, and GRSE and BDL appear to be the first ones to change their trend. Their bullish chart patterns feature a breakout, a bullish moment on the RSI, and the price is above a key moving average, indicating that upward momentum is growing. Despite the market being in a strong position, these stocks could potentially still offer good upside potential.
Disclaimer:
Note: The purpose of this article is only to share interesting charts, data points and thought-provoking opinions. It is NOT a recommendation. If you wish to consider an investment, you are strongly advised to consult your advisor. This article is strictly for educative purposes only.
Kiran Jani has over 15 years of experience as a trader and technical analyst in India’s financial markets. He is a well-known face on the business channels as Market Experts and has worked with Asit C Mehta, Kotak Commodities, and Axis Securities. Presently, he is Head of the Technical and Derivative Research Desk at Jainam Broking Limited.
Disclosure: The writer and his dependents do not hold the stocks discussed here. However, clients of Jainam Broking Limited may or may not own these securities.
The website managers, its employee(s), and contributors/writers/authors of articles have or may have an outstanding buy or sell position or holding in the securities, options on securities or other related investments of issuers and/or companies discussed therein. The content of the articles and the interpretation of data are solely the personal views of the contributors/ writers/authors. Investors must make their own investment decisions based on their specific objectives and resources, and only after consulting such independent advisors if necessary