

In racing, whether it’s a horse derby or any other, the horse is always the star of the show. But there’s one person who can make all the difference between winning and losing: the jockey. The jockey is the one who controls the horse, sets the pace at every twist and turn and uses strategy to ensure that the potential turns into victory.
Similarly, timing and leadership are the keys to success in the stock market. The jockey here is HDFC Bank, driving the performance of Bank Nifty and Nifty.
HDFC BANK: The Jockey with 32% Weightage in Bank Nifty
HDFC Bank isn’t just a participant in the Bank Nifty race; it’s leading it. With a massive 32% weightage in the Bank Nifty index, HDFC BANK isn’t just another stock, but rather the engine behind the performance of the entire sector.
The HDFC BANK stock price broke through an all-time high, crossing Rs 2,027 and entering uncharted price territory. This is like a jockey guiding a horse through tricky turns and keeping it on track toward victory.
HDFCBANK Weekly Chart
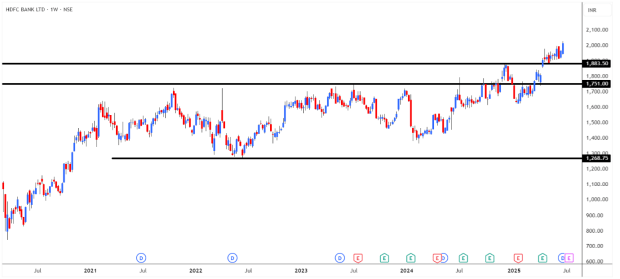
Looking at the weekly chart, we see that HDFC BANK has moved out of a long consolidation phase and made a strong bullish retest. This indicates that it’s not just going with the flow; it’s steering the entire index. The Bank Nifty, in turn, has also made new highs, largely thanks to HDFC BANK’s momentum. But now, the big question is, can HDFC BANK continue to play the role of the jockey and lead the way?
The Ratio Chart Analysis
To analyse the outperformance and underperformance of HDFC Bank against Bank Nifty and Nifty 50, the ratio chart can help answer the question. When the ratio is rising, it means HDFC BANK is outperforming; when it falls, it’s lagging behind.
HDFCBANK vs. Bank Nifty Ratio Chart
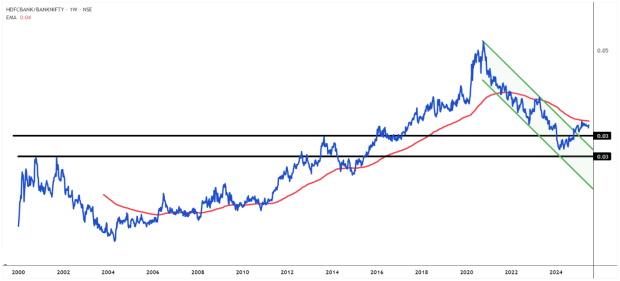
Analysing the ratio chart of HDFC BANK versus Bank Nifty on a weekly chart, we see a promising trend. The ratio has reversed from a multi-year breakout level, as the resistance has now become support. Post the reversal, the ratio breaking out from a falling channel pattern is another bullish sign, indicating that the HDFC Bank is regaining control.
However, there is a warning sign too. The ratio is yet to break above its long-term 200-week exponential moving average (WEMA) since 2021, indicating HDFC BANK hasn’t completely outperformed the Bank Nifty. The fight for leadership against its peers is still ongoing for HDFC Bank.
Moving ahead to analyse HDFC BANK’s performance in comparison to the Nifty 50, the picture isn’t different.
HDFCBANK vs. Nifty50 Ratio Chart
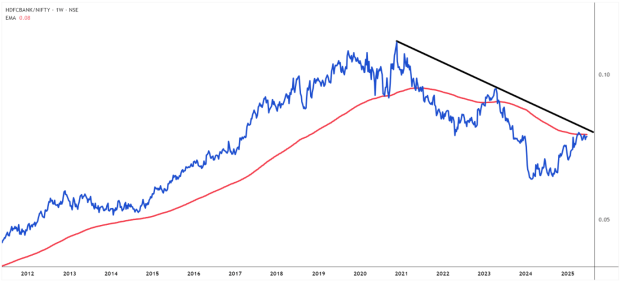
The ratio chart highlights HDFC BANK has struggled to maintain a position above 200WEMA on the ratio chart similar to the Bank Nifty. This signals HDFC Bank is facing stiff competition from other sectors and stocks within the Nifty 50. The Nifty 50, which is just 2.5% away from its all-time high, could be a significant hurdle for HDFC BANK in its quest for dominance.
Is HDFC BANK the Right Jockey for Bank Nifty?
From the charts, it’s clear that HDFC BANK is making a comeback on its individual chart, but the ratio charts suggest that HDFC BANK needs to surpass the major hurdle of 200 WEMA to lead from the front.
With a 32% weightage in Bank Nifty and 13% in Nifty50, it presents an opportunity for HDFC Bank to repeat its history as a true leader. The jockey needs to steer against its competitors to cross the finish line.
The race is on, and HDFC BANK is back in the saddle. But the finish line is still a few hurdles away.
Note: The purpose of this article is only to share interesting charts, data points and thought-provoking opinions. It is NOT a recommendation. If you wish to consider an investment, you are strongly advised to consult your advisor. This article is strictly for educative purposes only.
As per SEBI guidelines, the writer and his dependents may or may not hold the stocks/commodities/cryptos/any other assets discussed here. However, clients of Jainam Broking Limited may or may not own these securities.
Kiran Jani has over 15 years of experience as a trader and technical analyst in India’s financial markets. He is a well-known face on the business channels as Market Experts and has worked with Asit C Mehta, Kotak Commodities, and Axis Securities. Presently, he is Head of the Technical and Derivative Research Desk at Jainam Broking Limited.
Disclosure: The writer and his dependents do not hold the stocks discussed in this article. The website managers, its employee(s) and contributors/writers/authors of articles have or may have an outstanding buy or sell position or holding in the securities, options on securities or other related investments of issuers and/or companies discussed therein. The content of the articles and the interpretation of data are solely the personal views of the contributors/ writers/authors. Investors must make their own investment decisions based on their specific objectives, resources and only after consulting such independent advisors as may be necessary.