")

After an 8-session decline that dragged the Nifty down by 3.67%, the index has surged 4.85% in just 11 trading days. After the RBI policy at the start of October 2025, a few large-cap stocks have rebounded sharply from recent lows. As the second quarter results season gets underway, the Reliance and HDFC Bank stocks show traders and investors good risk-reward and bullish chart setups.
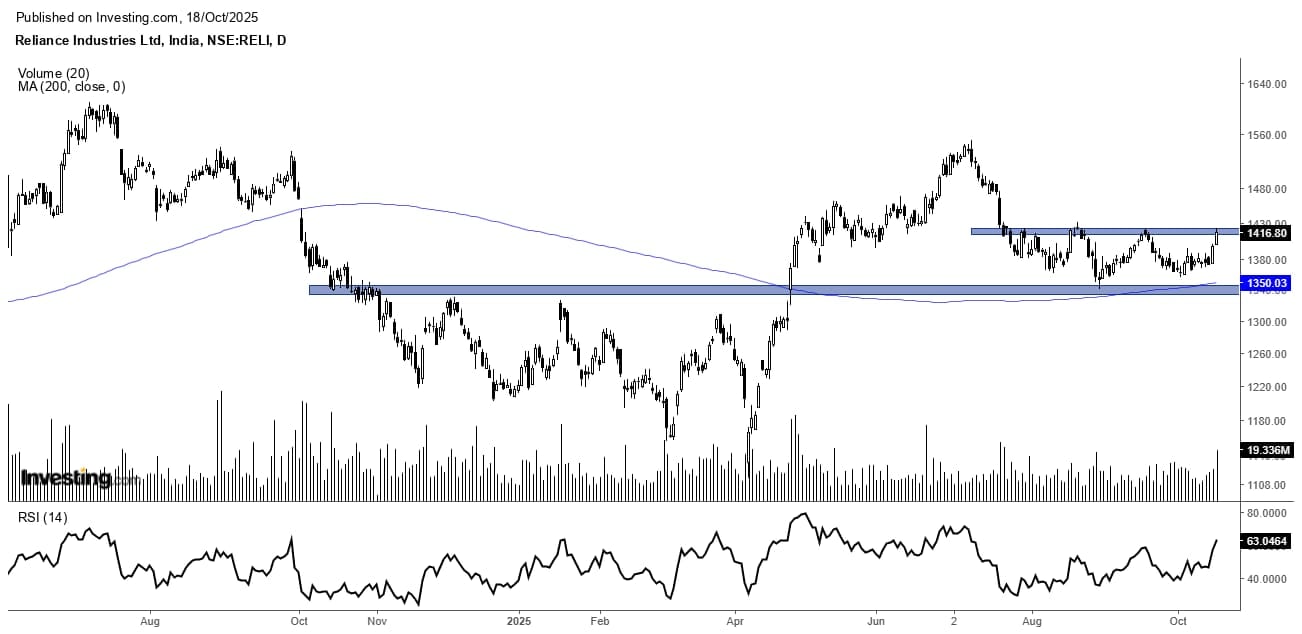
Reliance: Bullish Reversal Breakout
Reliance started its decline in July 2024 from an all-time high of ₹1,608, losing nearly 30% over nine months. Since April 2025, the stock has respected a rising trendline and it gave breakout from a triple-bottom pattern. Although it failed to hold ₹1,500, it found support at the previous breakout level. The stock is currently developing a higher-high, higher-bottom pattern and trading above its 200-day moving average, which is a major sign that the trend is about to change. 14 period RSI is moving into bullish territory with positive divergence, reinforcing the upside potential.
Key Reliance’s Potential Signs of Reversal
• Bullish Double Bottom patterns: The stock has given a fresh breakout from its double bottom pattern and successfully retested the resistance of triple bottom breakout.
• 200-Day Moving Average: The stock price is trading above its 200DMA, it signals the onset of an uptrend.
• Breakout with Volume: At current chart setup, we can see price is rising with rise in volume which indicates the successful breakout.
• The 14 Period RSI: The 14 period RSI is in the above 60 zone and showing that the stock is in strong bullish momentum.
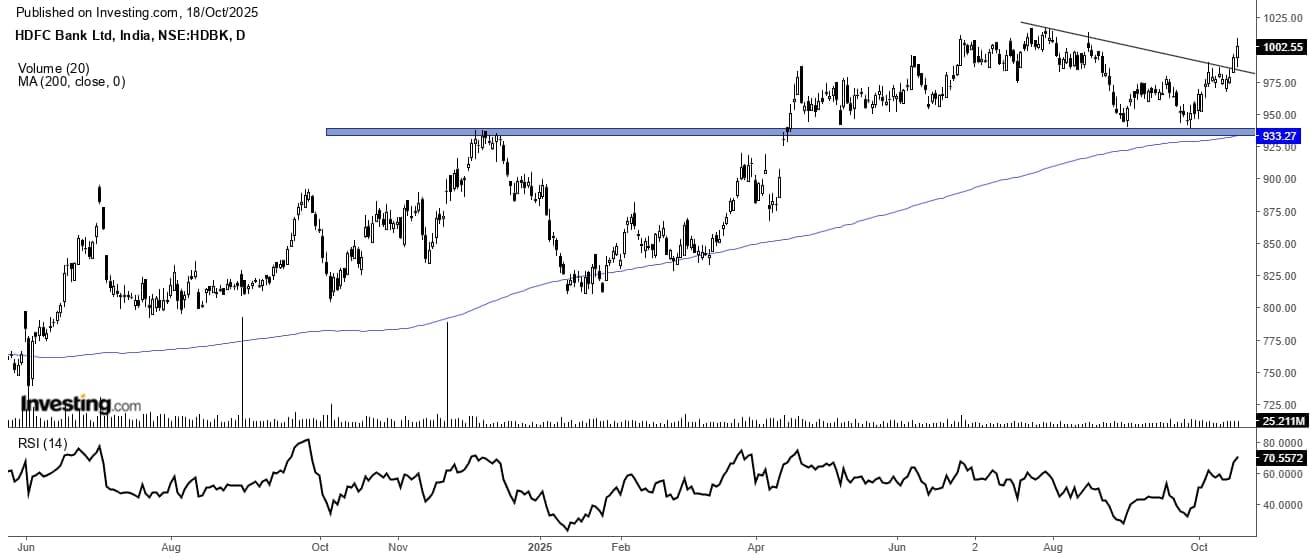
HDFC Bank: Bullish Breakout
Between June 2024 and August 2025, HDFC Bank had a surge from ₹750 to ₹1,000 before settling at ₹940. With the stock rising from ₹900 to ₹1,000, an 8% increase in just 13 days, the prior dip abruptly reversed. Strength is indicated by the price trading above the 200DMA and important resistance as well as the breakout from a descending triangle pattern. Bullish momentum is confirmed by an RSI over 60, indicating that the trend is probably going to continue in the near future.
HDFC Bank’s Stock Reversal Analysis
• Descending triangle pattern breakouts: On Daily chart, price has given breakout from descending triangle pattern with volume.
• Volume Surge Confirming the Breakout: Fall in price coincided with a fall in volumes and an increase in price has come with a rise in volume, which shows strong investor interest.
• 200 Day Moving Average: The stock price is trading above its 200 DMA. That means the stock is on an upward trend.
• RSI & Price Direction: 14 period RSI is above 60 zone and showing that the stock is in strong bullish momentum.
Final Take
The Indian stock market is still positive both technically and fundamentally as the holiday season approaches and the Q2 earnings season is just around the corner. Both HDFC Bank and Reliance Industries have a technically strong setups, both are trading above long term averages, supported by volume, and exhibiting strong RSI trends free of overbought indications.
Large cap stocks are spearheading the comeback. You should add both counters to your Diwali Muhurat Trading watchlist since they have the potential for a breakout.
Disclaimer:
Note: The purpose of this article is only to share interesting charts, data points and thought-provoking opinions. It is NOT a recommendation. If you wish to consider an investment, you are strongly advised to consult your advisor. This article is strictly for educative purposes only.
Kiran Jani has over 15 years of experience as a trader and technical analyst in India’s financial markets. He is a well-known face on the business channels as Market Experts and has worked with Asit C Mehta, Kotak Commodities, and Axis Securities. Presently, he is Head of the Technical and Derivative Research Desk at Jainam Broking Limited.
Disclosure: The writer and his dependents do not hold the stocks discussed here. However, clients of Jainam Broking Limited may or may not own these securities.
The website managers, its employee(s), and contributors/writers/authors of articles have or may have an outstanding buy or sell position or holding in the securities, options on securities or other related investments of issuers and/or companies discussed therein. The content of the articles and the interpretation of data are solely the personal views of the contributors/ writers/authors. Investors must make their own investment decisions based on their specific objectives and resources, and only after consulting such independent advisors if necessary.