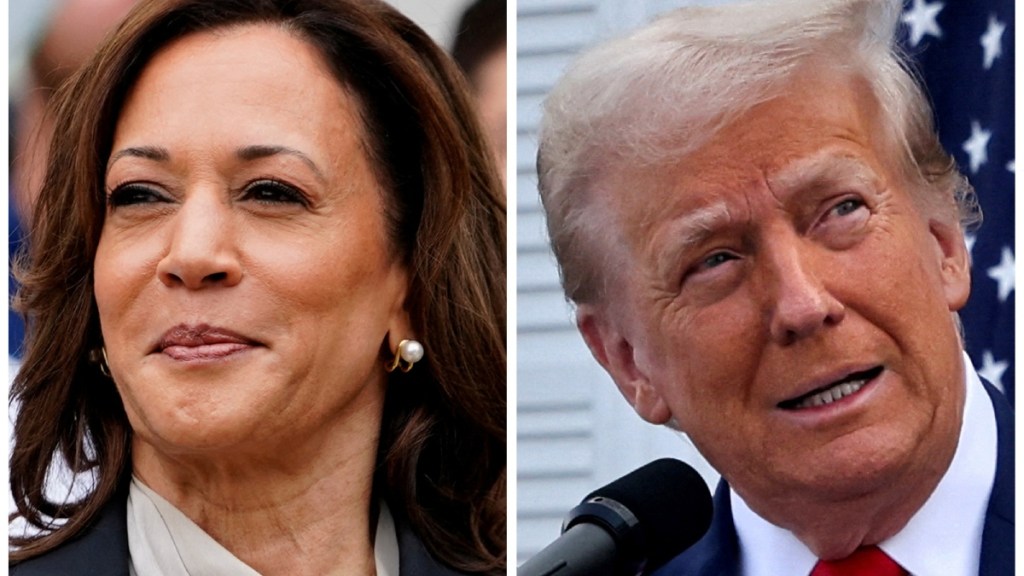
Donald Trump is now the US President-elect, set to become the 47th President of the United States.
In a closely contested race, Trump ultimately secured victory by surpassing the crucial 270 electoral vote threshold, with a key win in Wisconsin.
Following the election results, there’s widespread curiosity about how various demographics in the US voted. Let’s delve into the voting patterns across different groups.
US Elections 2024: How did the people of the US vote?
A BBC report on exit polls has shed light on the voting patterns across different demographics, offering valuable insights into the divides among voters.
The latest figures indicate that women leaned toward Kamala Harris, though perhaps not by the margins her campaign anticipated, with 54 per cent supporting Harris and 44 per cent backing Donald Trump.
Race-wise division
| Harris | Trump | |
| White | 41% | 57% |
| Black | 85% | 13% |
| Hispanic/Latino | 52% | 46% |
| Asian | 54% | 39% |
| Other | 42% | 54% |
How people of different age groups vote
| Harris | Trump | |
| 18-29 | 54% | 43% |
| 30-44 | 49% | 48% |
| 45-64 | 44% | 54% |
| 65 or over | 49% | 49% |
Graduates vs Non-graduates
| Harris | Trump | |
| College Graduate | 55% | 42% |
| No college degree | 42% | 56% |
(The report said that the sample size for the data was 22,509 respondents and that all figures have a margin of error. The source for the data is Edison Research/NEP vis Reuters.)
