
This is going to be a chart-fest. So let’s begin.
The India Rupee recently touched INR 91 to 1 US Dollar. It evoked many a meme from our social media enthusiasts. One such ‘India Rupee reaches Country Code’, equated the value of the Indian Rupee at 91 to India’s International Subscriber Dialling Code (ISD): +91.
There were several other commentaries on the Indian Rupee reaching ‘historic lows’, which seemed to happen every other day during this quarter.
INR loses value against DM and EM
The Indian Rupee reached ‘historic lows’ when expressed in a few other developed world currencies as well. It crossed the 100 mark this year against the Swiss Franc and the Euro. It scaled above the 100 mark again against the British Pound and has decisively moved towards 120.
The Data: Rupee vs. The world
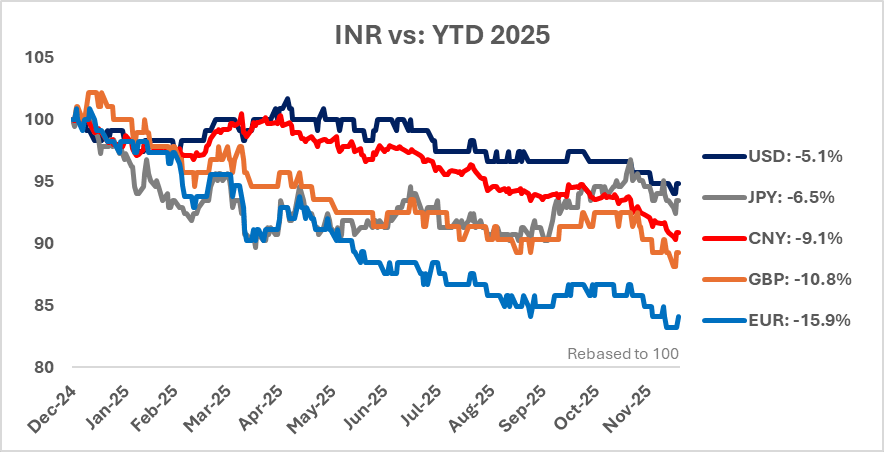
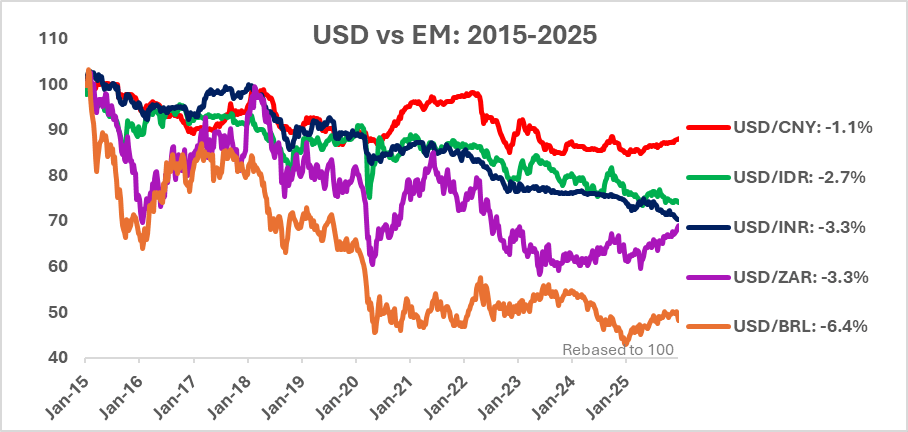
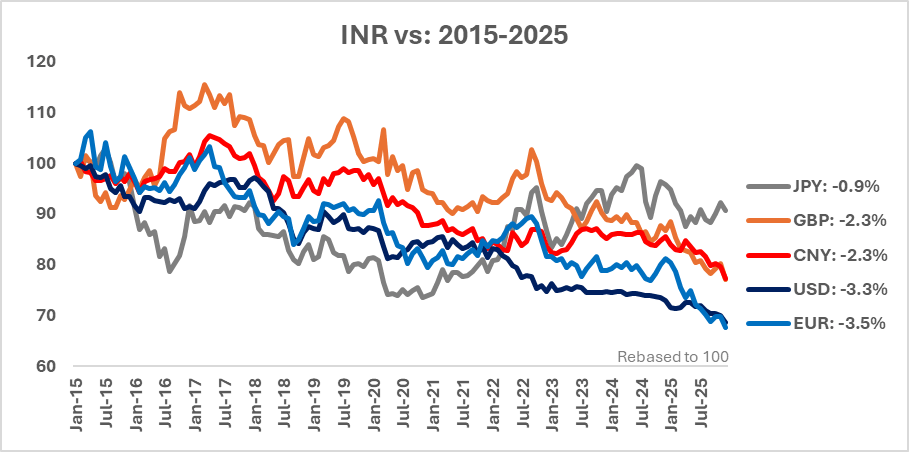
As the chart above shows, the Indian rupee has lost value against developed market currencies and even against our biggest competitor, China.
A quick glance should also tell the reader that the depreciation against the US dollar has been the lowest this year. This suggests that the Indian Rupee has lost value against the US dollar in a period where the US dollar has lost value against other developed world and emerging market currencies.
This is what has surprised most investors. Given how some other EM currencies have staged a sharp appreciation against the US dollar.
The concerned narrative on the value of the Indian Rupee this year is thus justified. Ideally, in a year when the base currency US dollar has been so weak, the Indian rupee should have held its ground or appreciated.
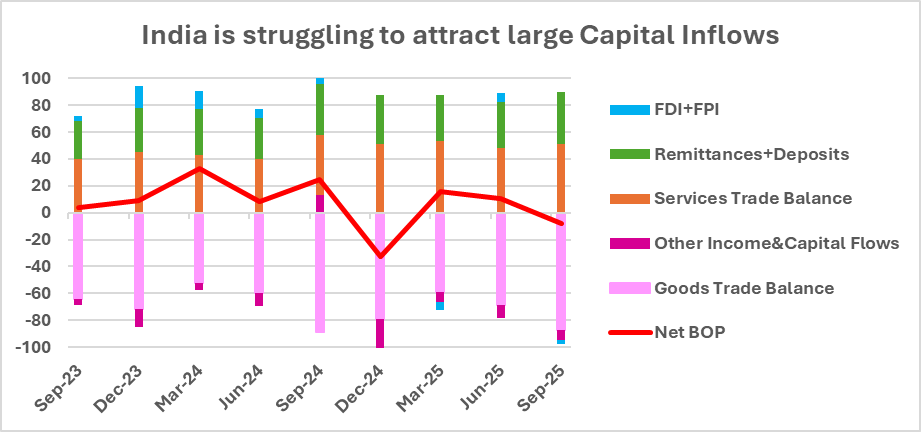
India is struggling to attract large capital inflows
However, on the back of continued weak net capital inflows, we have seen a trend towards a weaker rupee across currencies.
I wrote about the foreign investor ‘exiting’ in two previous columns for this Insight series.
Read this on why Foreign Direct Investments (FDI) net flows are almost zero. And why foreign portfolio investors (FPI) have sold over USD 25 billion of Indian stocks over the last year.
I summarised that low FDI inflows is not a crisis and that foreign investors are not ‘exiting’ India. However, I also noted as I have done through these columns, that India deserves to receive a lot more global capital than it does currently.
Foreign Investors have less than 1% of their portfolio invested in India. Many global MNCs have no major presence or plans to invest in India.
Will USD/INR hit a century?
As the above chart shows, India’s goods trade deficit and other income/capital outflows is matched by services trade surplus and inflows in the form of remittances and deposits from non-resident Indians. When net capital inflows (FDI/FPI/External Loans) are low, the overall capital account struggles and this requires either a depreciation of the rupee and/or dollar sales from FX reserves to fund the deficit.
This is the current scenario. Net capital inflows are very low and hence the Indian rupee is depreciating as a matter of demand/supply and in the hope that weaker INR slows down outflows and attracts fresh capital inflows. A natural adjustment process, which the RBI also seems to be allowing to take place.
Given that India now faces a punitive 50% tariff on a large portion of its goods export to the United States, it may be prudent to allow for some depreciation to allow pricing power to those exporters.
Against the US dollar, it though seems that the Indian Rupee is already under-valued. A common framework used is the REER (Real Effective Exchange Rate) which adjusts the nominal currency changes and inflation impact of a basket of countries with whom India trades.
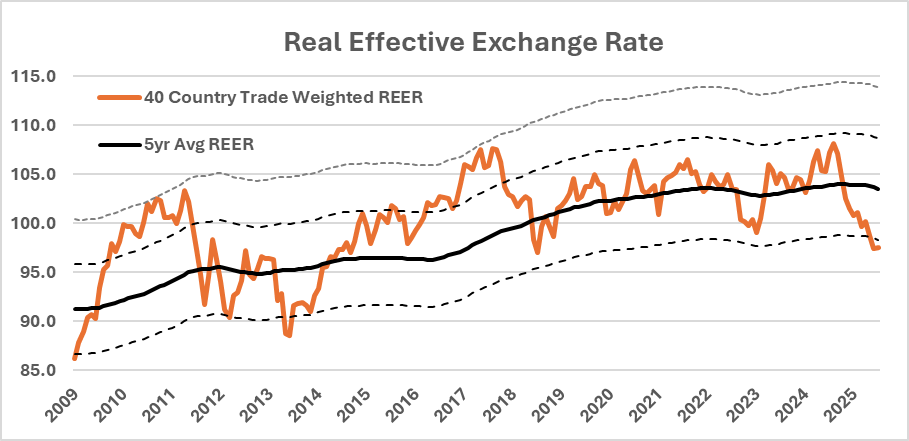
Given India’s relative low inflation and the extent of depreciation against the dollar, the 40-country REER based on its historical trade pattern was trading at 1 S.D (standard deviation below its long-term mean) back in October. The INR has lost further ground since.
It is not to say that it cannot trade and remain under-valued. However, even during the ‘fragile five’ episode of the summer of 2013, or post the great financial crisis, despite the large nominal depreciation, the REER measure seems to find support at those levels.
Is India Fragile Again?
A sharp depreciation brings back memories of 2013 when large current account deficits, high inflation and outflows by ‘bond-tourists’ led to >20% INR depreciation between May and August 2013.
However, the current account deficit remains muted ~1.0% of GDP, fiscal accounts are under check, inflation is below trend, and a lot of the capital outflows have already taken place.
The India macro environment remains stable with growth slowly on the mend. This is not a ‘fragile’ or ‘crisis’ scenario.
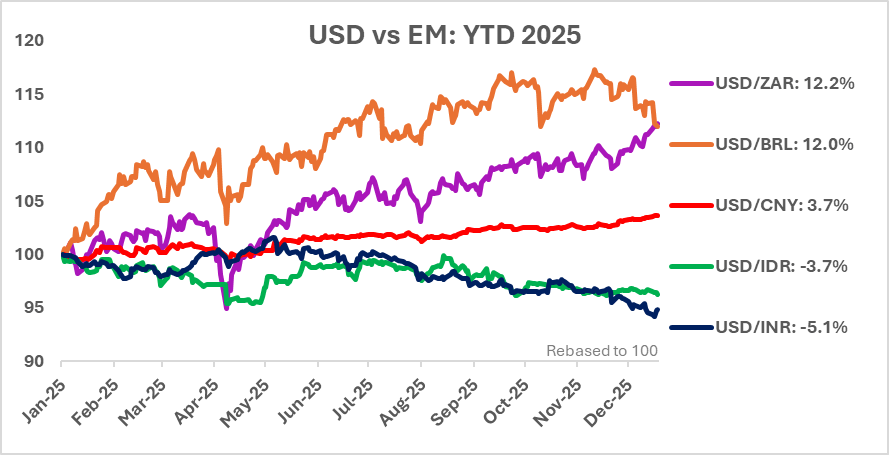
Despite, the large relative depreciation this year, the INR has held up reasonably well over the last decade where the US dollar has been remarkably strong. The rebased charts below against DM and EM currencies shows India’s relative stability and weakness at various times over the past decade.
The long-term average % changes also are similar to those seen over the past two decades.
What about India’s simple long-term investing story
It is always good to question, re-assess long-term assumption. Over the last year, two simple assumptions of the long-term India growth story have been under question.
I wrote about what ails India Nominal GDP growth and will it get back to its double-digit average growth level. I did show our assessment of why we believe India can continue to grow in double digits in nominal terms and 6.5% in real terms.
The other relevant aspect for foreign investors is the annual rate of rupee depreciation. We have guided a 2-3% annual rate of depreciation of the Indian Rupee against the US Dollar. Although, as we witness it, the depreciation rate is never a linear relation, and it goes through phases of some appreciation, stability, and sharp depreciation. It yet averages around the 3.0% annual level over the past 25 years.
Indian policy makers, politicians and the government need to take a hard look on certain structural aspects of growth, investment, sentiment, foreign investor interest, tax policy, rule of law, competitive intensity etc to attract long-term capital to boost growth, employment and incomes.
The simple, predictable story of Indian public equities can continue for the next decade but it cannot be taken for granted.
Arvind Chari is a Chief Investment Strategist and has been with Quantum Advisors India group since 2004. Arvind has over 20 years of experience in long-term India investing across asset classes. Arvind is a thought leader and guides global investors on their India allocation.
This article is for educational and discussion purposes only and is not intended as an offer or solicitation for the purchase or sale of any investment in any jurisdiction. No advice is being offered nor recommendation given and any examples are purely for illustrative purposes. The views expressed contain information that has been derived from publicly available sources that have not been independently verified. No representation or warranty is made as to the accuracy, completeness, or reliability of the information.
The views and opinions expressed in this article are my personal views and should not be construed of the Firm. There is no assurance or guarantee that the historical result is indicative of future results, and the future looking statements are inherently uncertain and cannot assure that the results or developments anticipated will be realized.