")
The first lesson every chartist learns in technical analysis is that history tends to repeat itself. Stock trends often form patterns that reappear over time, indicating to traders potential future moves. The higher the percentage of pattern repetition, the more chances that the trader may potentially go right.
But the market delivers something truly extraordinary, a pattern so rare that it has appeared only a handful of times in decades. This week, we are witnessing exactly that – a bearish close for six consecutive weeks on the Nifty index.
A Pattern with a History
This specific pattern of six straight weeks of negative weekly closes has occurred only twice in the last 20 years:
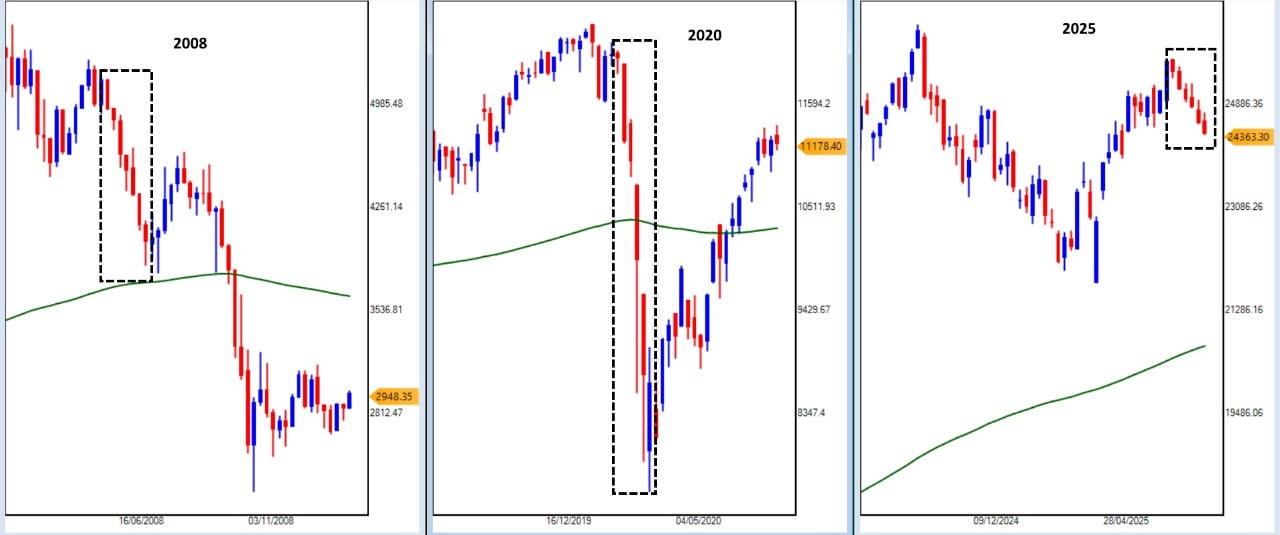
- 2008 – The Global Financial Crisis
The U.S. Housing Bubble burst triggering a global stock market collapse. The Indian stock market wasn’t spared; the Nifty witnessed this rare six-week losing streak as panic gripped worldwide.
- 2020 – The COVID-19 Crash
A black swan event like no other in Indian history. The Nifty plunged from 12,000+ to 7,511, marking a sharp and relentless downtrend. The second time we saw the same six-week bearish closing pattern as fear and uncertainty dominated global sentiment.
This Time, It’s Different… Or Is It?
For the third time in two decades, the pattern has emerged again. Unlike the economic turmoil of 2008 or the pandemic-driven collapse of 2020, 2025 presents a very different backdrop.
- Economic Conditions: India’s macroeconomic conditions remain positive with GDP growth forecasts staying optimistic, inflation moderating and corporate earnings primarily in line with expectations.
- Technical Positioning: The 200-Week Exponential Moving Average (200WEMA) is the benchmark for the long-term trend. In 2008, this rare pattern was formed around the average while in 2020, it formed below the long-term average. Currently, the Nifty’s 200WEMA is 15% below the 24,400 level, suggesting that bulls maintain control over the medium-to-long-term trend. (The green line on the chart).
Crash, Correction, or Reversal: Decoding the Signals
From a fundamental analysis perspective, the absence of a major economic shock could mean this streak is more of a technical correction rather than the start of a prolonged bear market.
For technical traders, this is a textbook case study in how rare patterns don’t always carry the same weight if the surrounding conditions differ. The upcoming weeks will determine whether the market treats this as a pause before another uptrend—or a deeper correction.
The Investor’s Playbook: What to Watch Now
- Patterns Repeat, but Context Matters: The same formation in different macroeconomic environments can produce completely different outcomes. Although 2008 saw a further decline in the pattern, 2020 marked a complete reversal.
- Watch the 200WEMA: As long as the Nifty trades significantly above this level, the primary uptrend remains intact.
This is a rare moment in Indian stock market history, only the third time in two decades we have seen this pattern. Whether it comes with a follow-up move like 2008 or becomes a turning point like 2020 or just a temporary dip will be the story to watch in the weeks ahead.
Disclaimer:
Note: The purpose of this article is only to share interesting charts, data points and thought-provoking opinions. It is NOT a recommendation. If you wish to consider an investment, you are strongly advised to consult your advisor. This article is strictly for educative purposes only.
Kiran Jani has over 15 years of experience as a trader and technical analyst in India’s financial markets. He is a well-known face on the business channels as Market Experts and has worked with Asit C Mehta, Kotak Commodities, and Axis Securities. Presently, he is Head of the Technical and Derivative Research Desk at Jainam Broking Limited.
Disclosure: The writer and his dependents do not hold the stocks discussed here. However, clients of Jainam Broking Limited may or may not own these securities.
The website managers, its employee(s), and contributors/writers/authors of articles have or may have an outstanding buy or sell position or holding in the securities, options on securities or other related investments of issuers and/or companies discussed therein. The content of the articles and the interpretation of data are solely the personal views of the contributors/ writers/authors. Investors must make their own investment decisions based on their specific objectives and resources, and only after consulting such independent advisors if necessary