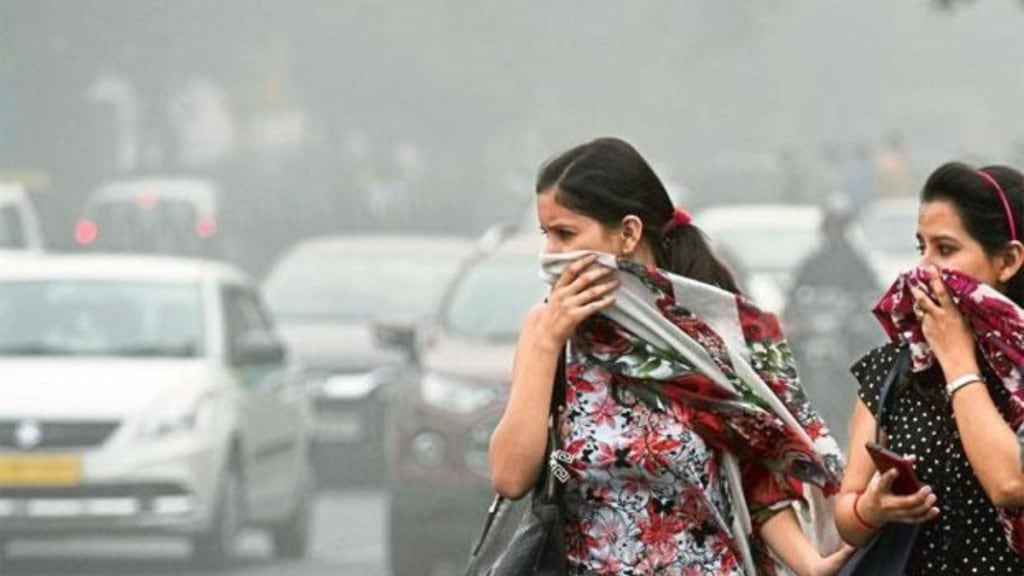
The air quality in Delhi worsened over the weekend, slipping past the 400 mark to fall well into the “severe” category. A toxic haze lingered over the city as the overall Air Quality Index (AQI) stood at 391 by 7 am on Sunday morning. The Delhi-NCR region is yet to impose GRAP III measures despite a Supreme Court order that made the curbs mandatory from last year.
Central Pollution Control Board (CPCB) data on Sunday morning showed multiple Delhi neighbourhoods with AQI well into the severe level. Anand Vihar recorded an AQI of 412, Alipur reported 415, and Bawana registered the highest level at 436. Chandni Chowk recorded an AQI of 409, while RK Puram and Patparganj logged 422 and 425, respectively. Sonia Vihar also recorded a “severe” AQI of 415, indicating hazardous air conditions across the city.
An AQI between 301 and 400 is considered “very poor” with the potential to cause “respiratory illness on prolonged exposure”. The final level of the Air Quality Index is the severe category, ranging from 401 to 500. At this point, the air quality can “affect healthy people and seriously impact those with existing diseases”.
Delhi AQI at 9 am today
| Station | Index Value | Air Quality |
|---|---|---|
| Anand Vihar | 412 | Severe |
| Ashok Vihar | 412 | Severe |
| Aya Nagar | 365 | Very Poor |
| Bawana | 436 | Severe |
| Burari Crossing | 429 | Severe |
| CRRI Mathura Road | 417 | Severe |
| Chandni Chowk | 407 | Severe |
| DTU | 318 | Very Poor |
| Dr Karni Singh Shooting Range | 407 | Severe |
| Dwarka-Sector 8 | 385 | Very Poor |
| IGI Airport | 358 | Very Poor |
| IHBAS, Dilshad Garden | 267 | Very Poor |
| ITO | 420 | Severe |
| Jahangirpuri | 433 | Severe |
| JLN Stadium | 395 | Very Poor |
| Lodhi Road (IITM) | 308 | Very Poor |
| Lodhi Road (IMD) | 376 | Very Poor |
| Major Dhyan Chand National Stadium | 381 | Very Poor |
| Mandir Marg | 389 | Very Poor |
| Mundka | 424 | Severe |
| NSIT Dwarka | 199 | Moderate |
| Najafgarh | 353 | Very Poor |
| Narela | 418 | Severe |
| Nehru Nagar | 425 | Severe |
| North Campus | 401 | Severe |
| Okhla Phase-2 | 405 | Severe |
| Patparganj | 424 | Severe |
| Punjabi Bagh | 414 | Severe |
| Pusa (DPCC) | 403 | Severe |
| Pusa (IMD) | 384 | Very Poor |
| R K Puram | 423 | Severe |
| Rohini | 435 | Severe |
| Shadipur | 360 | Very Poor |
| Sirifort | 404 | Severe |
| Sonia Vihar | 415 | Severe |
| Sri Aurobindo Marg | 371 | Very Poor |
| Vivek Vihar | 424 | Severe |
| Wazirpur | 432 | Severe |
As of 9 am today, cities with moderate air quality included Jaipur (188) and Lucknow (189), while Ahmedabad (135), Bengaluru (129), and Chennai (106) also fell under the moderate category. Hyderabad (95) and Pune (97) were classified as satisfactory, while Mumbai (119) and Patna (150) recorded moderate air quality levels.
It is to be noted that according to the CPCB classification, an AQI between zero and 50 is considered “good”, 51-100 “satisfactory”, 101-200 “moderate”, 201-300 “poor”, 301-400 “very poor”, and 401-500 “severe”.
Delhi-NCR AQI on November 8: Area-wise list
| City/Town | Index Value | Air Quality |
|---|---|---|
| Delhi | 361 | Very Poor |
| Bhiwani | 253 | Poor |
| Charkhi Dadri | 302 | Very Poor |
| Faridabad | 264 | Poor |
| Ballabgarh | 129 | Moderate |
| Gurugram | 236 | Poor |
| Manesar | 291 | Poor |
| Bahadurgarh | 325 | Very Poor |
| Jind | 295 | Poor |
| Karnal | 264 | Poor |
| Narnaul | 215 | Poor |
| Mandikhera | 86 | Satisfactory |
| Palwal | 126 | Moderate |
| Panipat | 282 | Poor |
| Dharuhera | 152 | Moderate |
| Rohtak | 374 | Very Poor |
| Sonipat | 251 | Poor |
| Alwar | 82 | Satisfactory |
| Bharatpur | 106 | Moderate |
| Bhiwadi | 215 | Poor |
| Baghpat | 285 | Poor |
| Bulandshahr | 307 | Very Poor |
| Khurja | 312 | Very Poor |
| Noida | 354 | Very Poor |
| Greater Noida | 336 | Very Poor |
| Ghaziabad | 339 | Very Poor |
| Hapur | 334 | Very Poor |
| Meerut | 318 | Very Poor |
| Muzaffarnagar | 278 | Poor |
Air quality levels and possible health impact
According to CPCB, “Good” air indicates minimal or no health impact and poses little risk to anyone. When the air quality is “Satisfactory,” it may cause minor breathing discomfort to sensitive individuals such as children, the elderly, or those with pre-existing respiratory issues.
A “Moderate” air quality level can lead to breathing discomfort among people with lung diseases, asthma, or heart conditions. As the air quality worsens to the “Poor” category, most people may experience discomfort after prolonged exposure.
In the “Very Poor” range, long-term exposure can trigger respiratory illnesses even in otherwise healthy individuals. At the most critical level, “Severe,” air pollution affects healthy people and poses serious health risks to those with existing diseases.

